I am going to start the probability unit with my year 9 middle set class this week and have decided to start with listing outcomes. I have the lesson planned and then i started thinking about all the approaches we teach when teaching probability; using a probability tree, sample space diagrams, listing outcomes, venn diagrams, two way tables. I started to wonder how many of my class know why some are useful in some situations for example for 2 events where you want to know all the outcomes or if its just to know P(flipping 4 tails in a row)
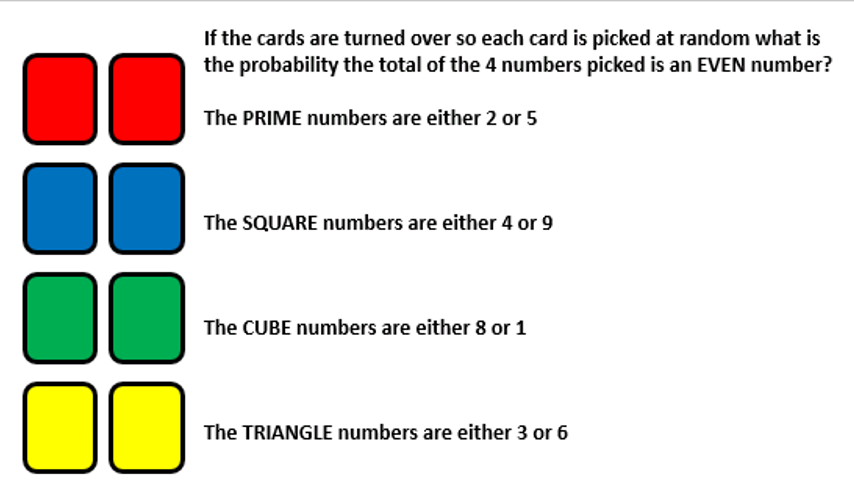
I thought a good discussion point could be this question I have created. It also recaps a previous topic on types of number and a previous discussion on what happens when odd/even numbers are added.
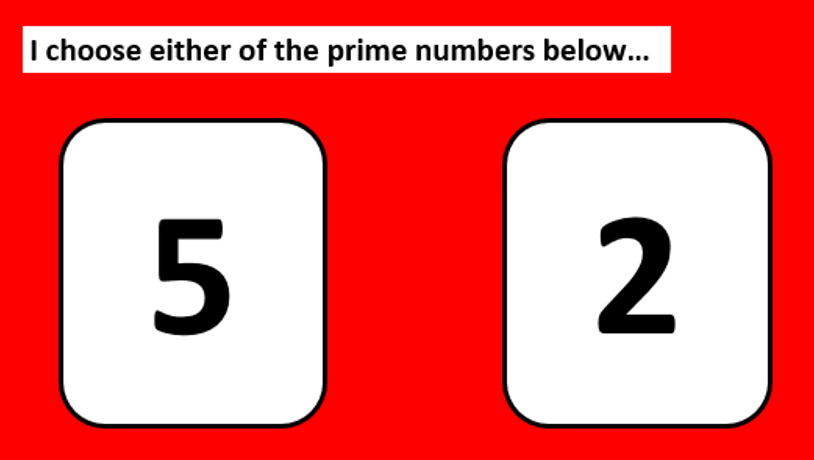
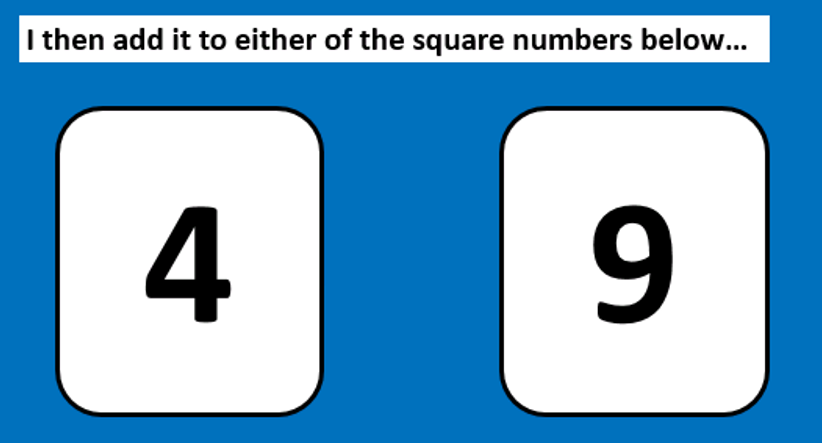
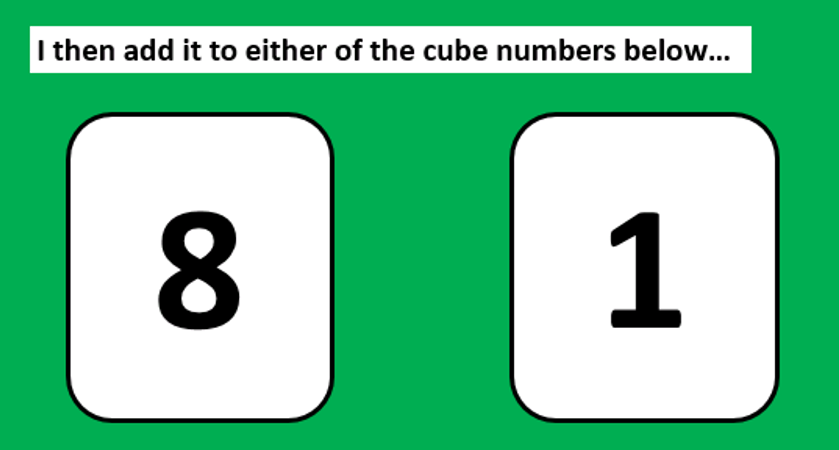
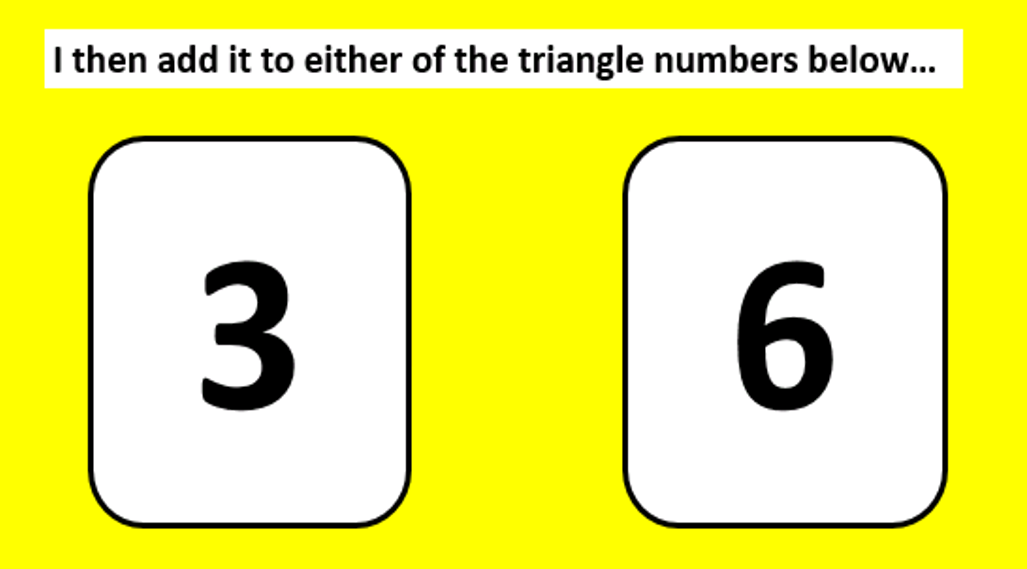
Students could list the outcomes, discussions could be had on how many there would be first. Students could use a probability tree and discuss why other types of diagrams aren’t helpful.
UPDATE!
Multiple ways to look at a problem


