Speeds

BLY shared this Question and a solution using Algebra. Even though the question asked for an algebraic approach I wanted to look at other methods for solving.

I liked BLYs algebraic method

but I wanted to visualise the problem so used the knowledge that if the lorry is 12mph slower than the car and took an hour longer then you could plot two speed-time graphs. One T=240/x where x is the speed of the car and 240/(x-12) then look for the value on the graph where the T values are 1 hour apart

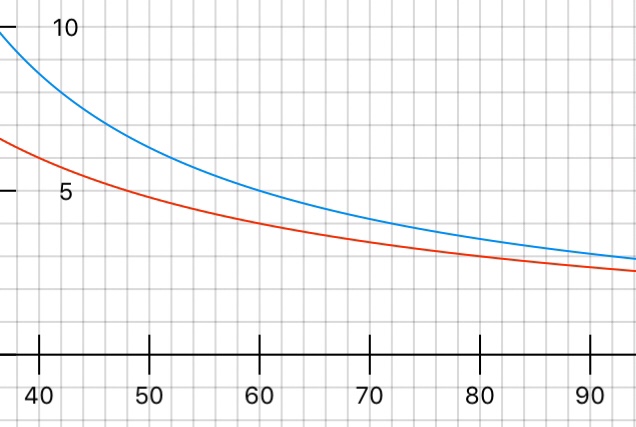
So I can see the red graph (240/x) is at 60, 4 and the blue is at 60,5 which is an hour apart. So the cars speed was 60mph.

The second method used a bit of trial and errors. I made x represent the speed of the lorry and so 5x was the distance over 5 hours and that gave me 240

If the lorry travels at a 12mph slower speed but takes an hour longer then the speed of the car would need to equal 12mph x how many hours the lorry travelled for.

Pythagoras

The following post isn’t filled with great teaching ideas but more a collection of tried and tested Pythagoras Resources that i have used recently

I like to start with a question on square numbers or square roots to start with, i find this helps iron out issues with squaring and not doubling. I used the following starter this week:

squares

Then after discussing what Pythagoras’ Theorem is i use the following questions. Not terribly exciting, but its straightforward and my foundation students like working through the questions. More interesting and varied questions can come when they are secure in how to apply the theorem to basic right angled triangles.

Pythagoras 2

pyth3

I then like to finish with a BINGO activity: Pythagoras

pyt1pyt2

and sometimes a match up task:

Pythagoras Match uppmatch1.pngpmatch2.png

Geometric Sequences

I wanted to introduce my year 8 class to Geometric Sequences. I had originally planned to show them a task similar to the task I had used for Quadratic Sequences:

https://mathshko.wordpress.com/2018/04/24/quadratic-sequences/

but then last minute i changed my mind and thought i would given them a starter based on Sierpinskis Triangle. My decision to switch was partly down to the fact i wanted them to have an opportunity to view the effect of geometric progression on an image. The task was simple; find how many triangles of each type there is in the image but it doesn’t include rotated versions of the triangle.

IMG_0184IMG_0185

Students quickly spotted things about the diagram like, there was a copy of 3’s of each triangle and the connection between each number was x3. They spotted things like 3 squared was 9 and 3 cubed was 27 so the numbers were all powers of 3.

I asked students what the next term in the sequence would be and they worked out 243. One Student commented on the fact that the smallest triangles in the image would have 81 x 3 triangles because the image shown would be repeated 3 times. It was nice when a student suddenly said ‘i’ve got it! its 3 to the power of n, divide by 3’ (I hadn’t asked for a rule or anything)

As everyone in the class had time to check this general rule worked (nth term) a student noted that it would be 3 to the power but its the second term starts at 3 not the first. We then moved to discussing 3 to the power n-1

Next I gave Students the task below. Students either started to double the values or tried short cuts like; multiplying 8p by 5 as 8p was day 4 or other similar ideas. After a while a student raised their hand and realised that there was a pattern. That all the numbers in the second column ended with a 2, the third column ended with a 4 and 4th with a 8 but the 1st column had a 1 then 6 after. Her idea was soon passed around the classroom like wildfire and students discussed why it had to work and more generally what effect doubling has on numbers. Student discussion turned to the idea that the rule could be 2 to the power of n. suddenly the connection to the triangle starter was made and that the rule was in fact 2 to the power n but it needed to be halved after.

Screen Shot 2018-05-09 at 20.47.16

Screen Shot 2018-05-09 at 20.47.23Screen Shot 2018-05-09 at 20.47.31Screen Shot 2018-05-09 at 20.47.37

IMG_0181IMG_0180IMG_0179

Proportional Reasoning

Year 10 have just sat a mock paper and I was surprised how many questions that students made more complicated by how they answered them. Students seemed to opt for formula or find things they don’t need.

I picked out some of the types of questions students struggled with most (proportional reasoning questions) and created the following 6 questions. Here’s a pdf link if you want to try the questions with your class.

pic of prop ques

Proportion Questions

results prop 1`

I gave the questions to a low attaining class, my own middle set class and a high attaining class to see how they each would fair. I then recorded how they answered the question and took photos of anything interesting. The percentage who answered correctly is shown for each group. The results are in order of low attaining, middle and high attaining classes. Below is a sample of some of the students responses…

I guess the next step is to look at how we can address the issues especially with middle and low attaining students. Avoid solely using ‘triangles’ and formula when teaching speed but let them see it proportionally. s=d/t might work for ‘find the average speed when you travel 145 miles in 5 hours’.

Students need to be exposed to the relationships in pie charts. if 50 degrees represent 165 people then 10 degrees represent 33 as well as 50 x 3.3 = 165 so 10 x 3.3 = 33

On the back of this exercise i created another resources for SDT

https://mathshko.wordpress.com/2018/02/06/speed-distance-time/

IMG_0083IMG_0084IMG_0085IMG_0086IMG_0087IMG_0088IMG_0089IMG_0090IMG_0091IMG_0092IMG_0093IMG_0094IMG_0095IMG_0096IMG_0101

Screen Shot 2018-06-06 at 21.37.49Screen Shot 2018-06-06 at 21.37.36Screen Shot 2018-06-06 at 21.29.47

Used the activity above a few times recently. It’s interesting when the students get to 4/5 of a number is 3 what’s 8 times my number. The can’t easily use a method such as finding 1/5 then 1 whole and multiply by 8 but if they recognise that 8 is 40/5 then it’s 30 because it’s 10 lots of 4/5 and 3.

Quadratic Sequences

I had a look some sequences with year 8 today. A real variety of different sequences; linear, quadratics, Geometric, Fibonacci etc. We spent some time on linear sequences and there were patterns and they noticed how the patterns always increased by the same amount each time. When it came to the quadratic sequences they noticed that the second difference between each term was the same and they recognised the sequence 1, 4, 9, 16, …

so i thought it would be a good to use some visual representations. Students could use the colours to help them see the blue is a constant addition and the red being linear. The next term could be an image or a number. I hope this will help students notice patterns and they are able to make generalisations.Screen Shot 2018-04-24 at 21.45.34Screen Shot 2018-04-24 at 21.45.42

UPDATE!

I used the above resources with year 8 today. They said they really enjoyed it, they liked how they could draw or write the next term in the sequence and some recognised the quadratic part and then once you subtracted that if what remained was a constant number or a linear sequence you could finished the nth term.

jeena

We did move onto a numerical sequence without images:

6, 11, 18, 27, 38

Students removed 1,4, 9, 16, 25 and were left with 5, 7, 9, 11, 15, they easily found 2n+3 and so managed to get the nth term. They visualised the picture and saw it had yellow squares, then red rows increasing in twos and then 3 blue added each time.

Estimation

I am constantly estimating…

photocopying: Roughly 30 students in each class, 3 lessons a week, 5 classes, so about 500 sheets, 2p a copy…

Petrol: Its 1.29 a litre so roughly 1.30 and i got 40 litres so its under 52

Shopping: This costs £4.99 and I have 7 items at 99p, so roughly £12

Time: It takes about 30 mins to get there and same back, add 10 mins for traffic (total), about 1hr there so ill be gone more than 2 hours

I don’t think it is something students find natural.

This question was a common exam question until the exam changed:

By rounding to 1sf calculate 3.6 x 110

Most students can get 400 for the above question but when left to chose how to round and estimate, the answers are more varied. Some choose not to round the 110 others will keep the 3.6. You could argue they have a more accurate answer this was as 360 is closer to 396 and similarly with 440.

Admittedly the calculation isn’t too challenging if its 4 x 110 but if a students is faced with a calculation such as;

13.8 x 19.1 and they approximate it to 13 x 19 they would make their answer slightly easier to work out. I suppose it can depend on why and for what use you are estimating.

estimate 2

The other issue I find with estimation is students are not always clear whether the answer is an over or under estimate and when they have an answer that’s a decimal  students don’t know when to round up or down. For example

estimate

After students calculated 37/3.5 = 10.57… approx 11 but 11 wouldn’t work in this situation.

So i like students thinking about estimating

estimate 3

How were these estimation calculated?

Without working out the exact answers, which were over/under estimates?

How would you work out an estimate for each?

Screen Shot 2020-01-27 at 22.56.00Screen Shot 2020-01-27 at 22.32.14


The Bead Problem

The Question:

beads.png

BLYs Method

bead

HSAs MethodBead Question

SMAs Method

Would have done it similarly but without introducing the variable B, so all in terms of R

R : 4R

R+7 : 3(R+7)

We know the Bs were unchanged so

4R = 3(R+7)

Giving us R=21

And then B is 3(21+7)=84