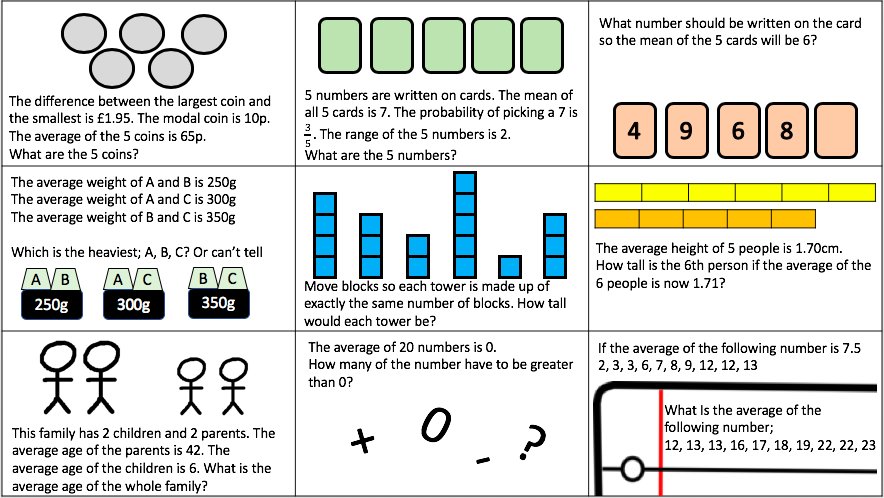
I like to use the following starter when I start teaching Averages and Range. Students can use words such as Mode, Median, Mean and Range if they want to at this stage but it is nice for them to have a visual (actual blocks have been used where needed) and an example to refer to later in the lesson. If a student is struggling to calculate the mean, they could be reminded of how you break up the towers and rebuild them as towers of equal height.

I find it easy to visualise all numbers as towers, even if i’m asked a question such as;
The scores on a recent Maths Test for a year 10 class are recorded and the mean is 24.4% for the class of 10 students.
Another Student joins the group, and the Mean is now 24%
What did this student score on the test?
I can imagine there are 10 towers of 24.4 blocks high. So there are 244 blocks in total. If the mean goes down to 24 blocks and there are 11 towers. We know there are 264 blocks. We can see there are 20 more blocks added so they scored 20%