I’m not sure this is an activity I can use in the future as its more relevant to now but I wanted to relate time series to something current. I struggle to teach these topics as I feel we often use “made up” data. I like to use the students data for many data topics…
EG: I ask students to hold their breath on two occasions in a lesson and record the times for both and plot a scatter diagram
I plot their test 1 and test 2 scores from recent assessments and compare the results.
If I’m looking at frequency tables we collect data on students favourite number between 1-100 or the number of pets owned.
All of these are time consuming but I feel its better to look at a couple of scatter diagrams or frequency tables, pie charts etc in a lesson if the data has come from the students because we can predict how we think the results may look and discuss any outliers.
When it comes to Times Series I find collecting student information tricker. So we often look at sales of ice-cream over the course of a year or similar which is data that is often made up for the sake of the lesson.
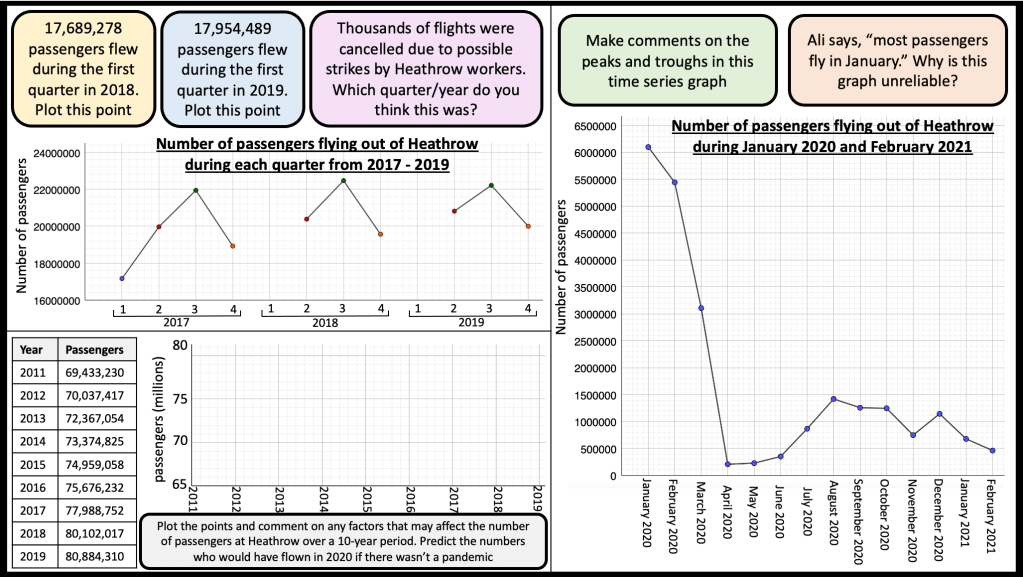
I thought about how covid-19 would affect certain time series and after reading an article about a huge drop in passenger numbers at Heathrow in 2020 I decided to focus on passenger numbers at Heathrow for this topic.