
After spending time looking at Angles in a full turn, on a straight line and in triangles I decided I wanted to practice these but linking them to quadrilaterals.


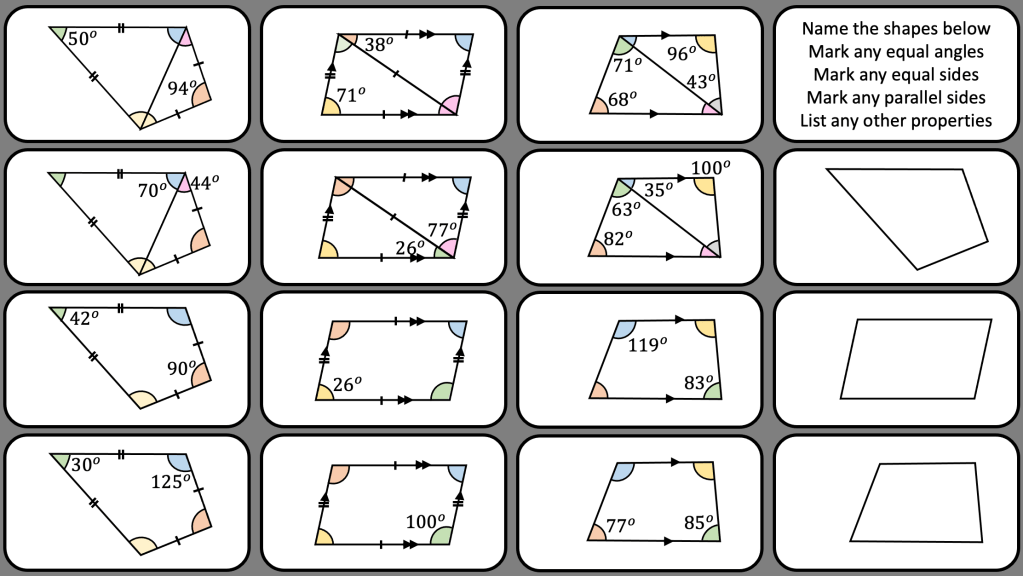
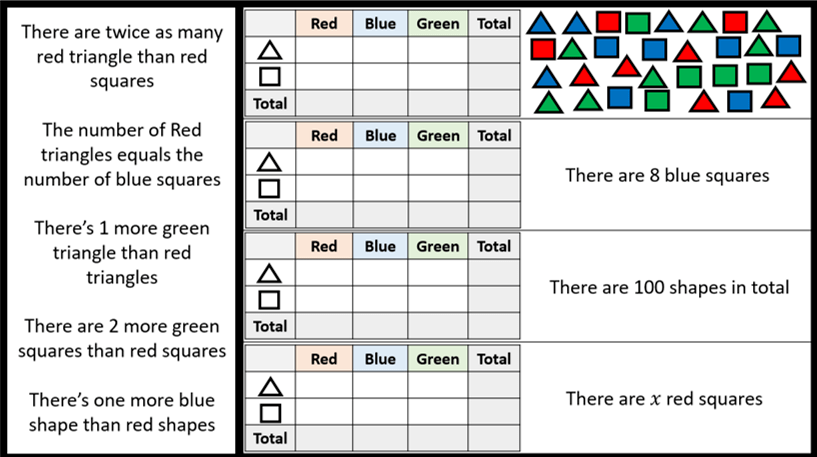
So after the above tasks along others, I moved to the task below. We discuss the properties of shapes which was a recap because we’d looked areas of 2D shapes before Christmas and had considered the properties to help. I wanted students to work out the top 3 Qs using angles in a triangle and then we stopped to discuss what we noticed…
“kites have a pair of equal angles and a line of symmetry or two isosceles triangles”
“parallelograms have opposite angles that area the same”
“Trapeziums have angles that add to 180” *students pointed to which were equal
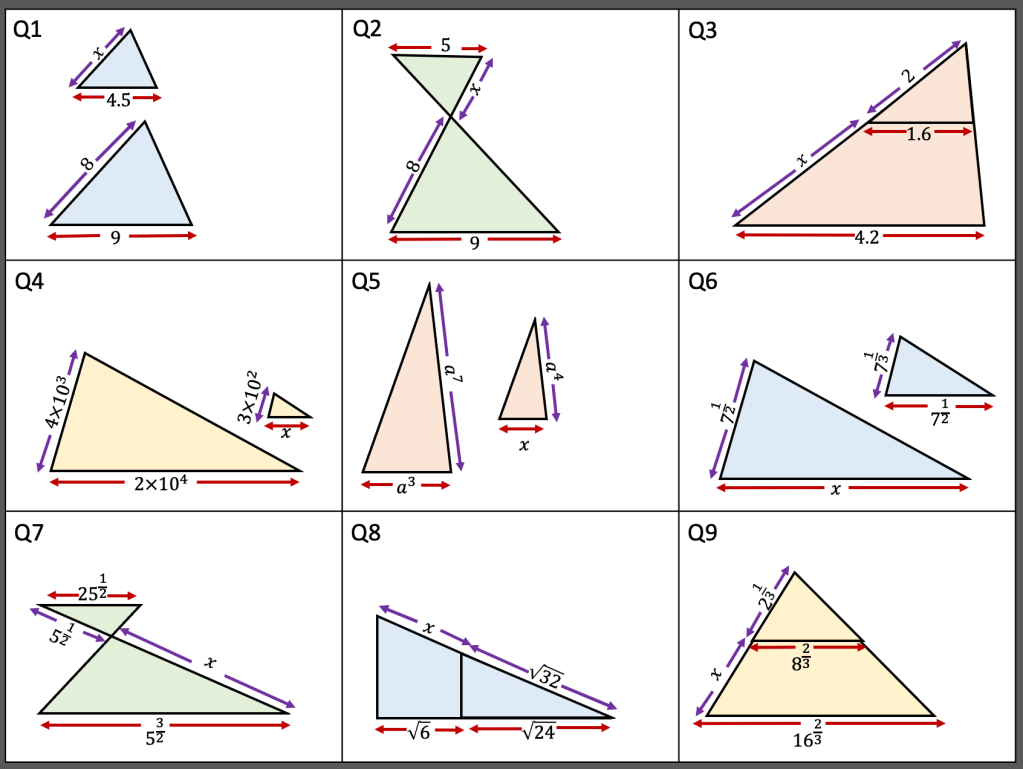
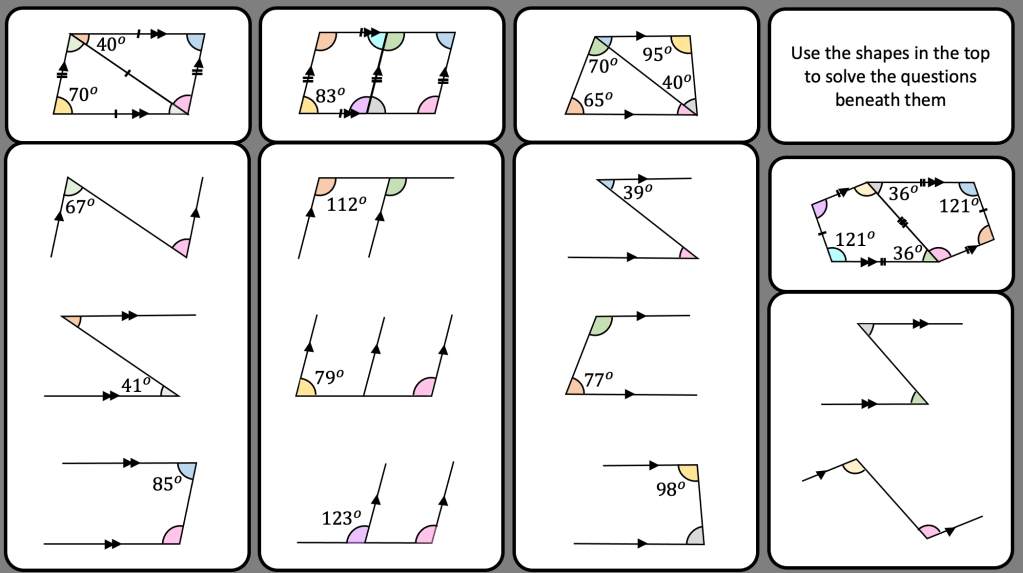
The next step is to try the task below… I want to introduce the parallel lines element of the shapes and what we can notice.
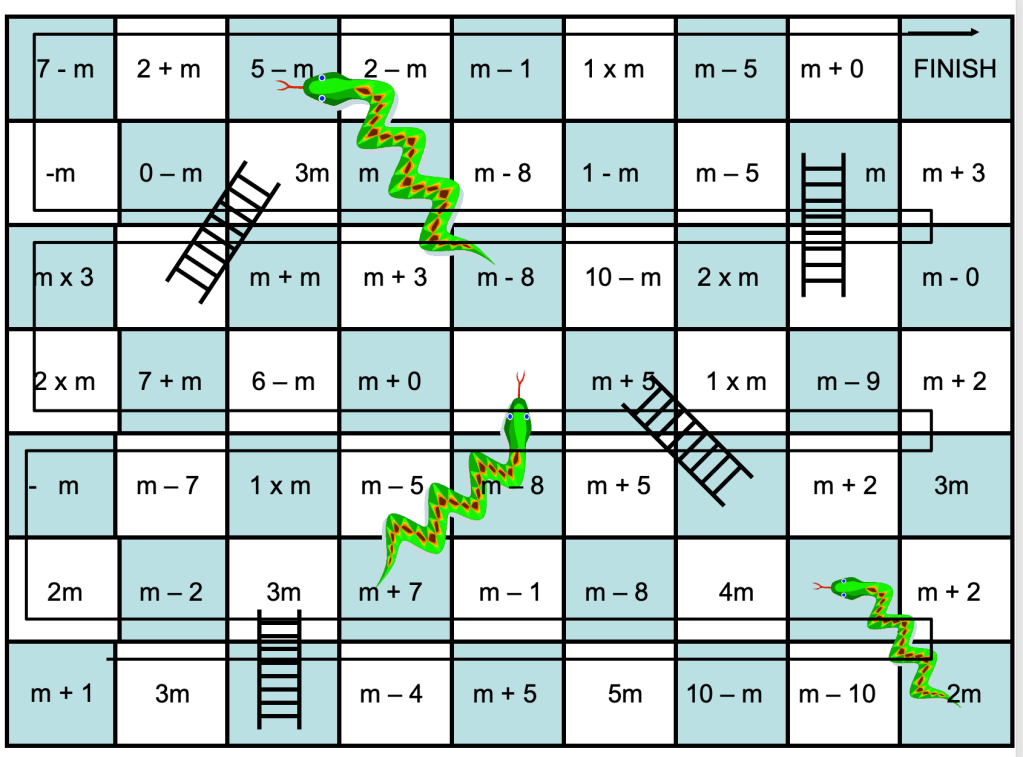
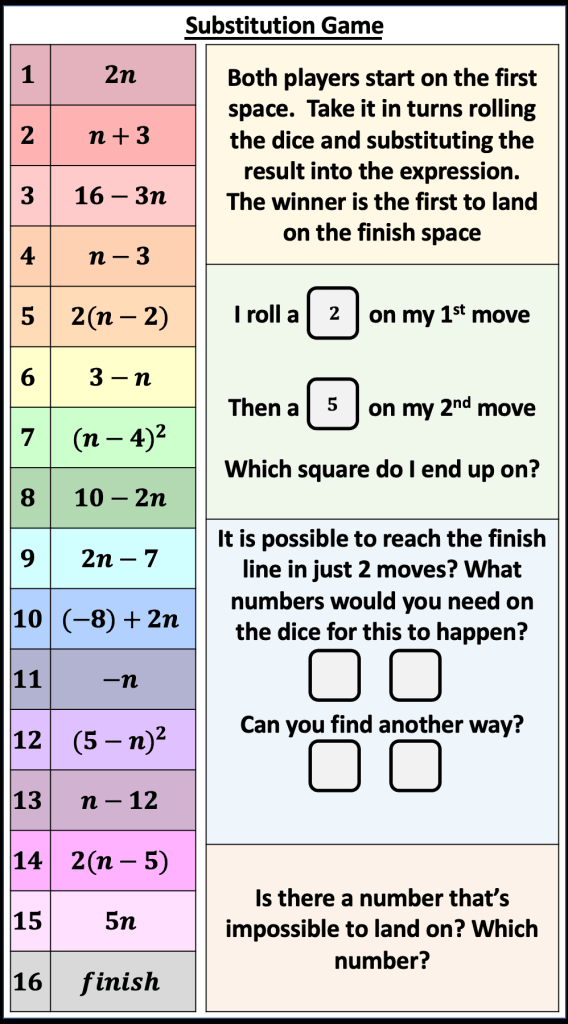
I found this task I made about 10+ years ago. It’s a snakes and ladders game where you roll a dice (soft dice are great) and substitute the value into the expression. I don’t really like the task now but it was still on a ppt I had for substitution and the students spotted it and wanted to play. So I printed it and they played it next lesson. I decided I wanted to update it and so I made the task further down. I also used a MCQ sheet for practice too.
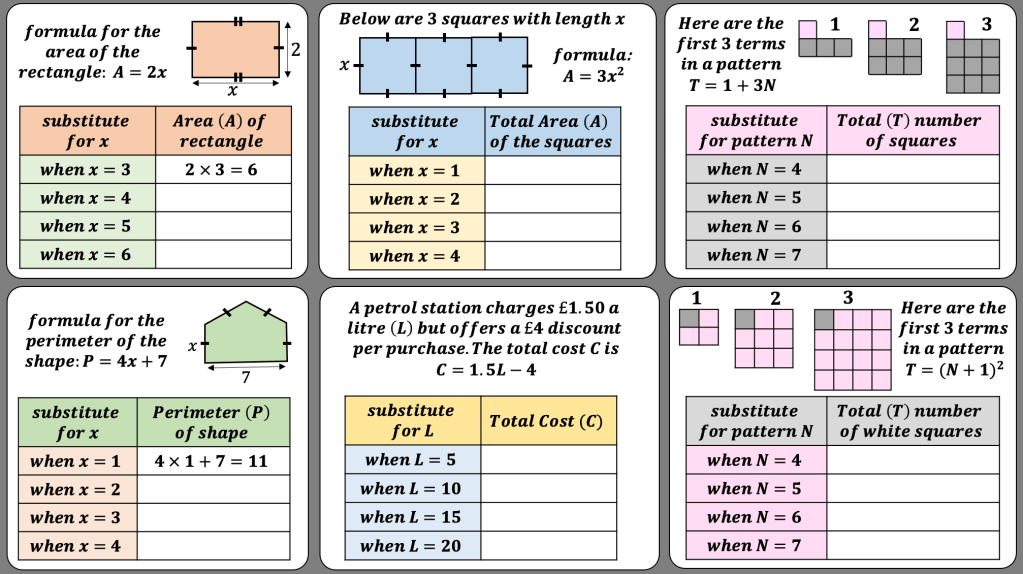
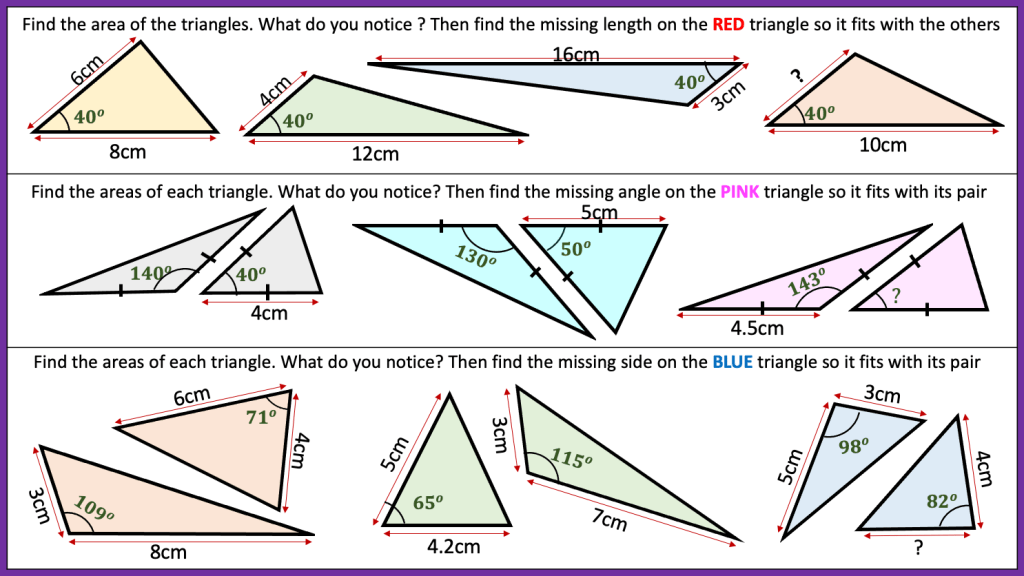
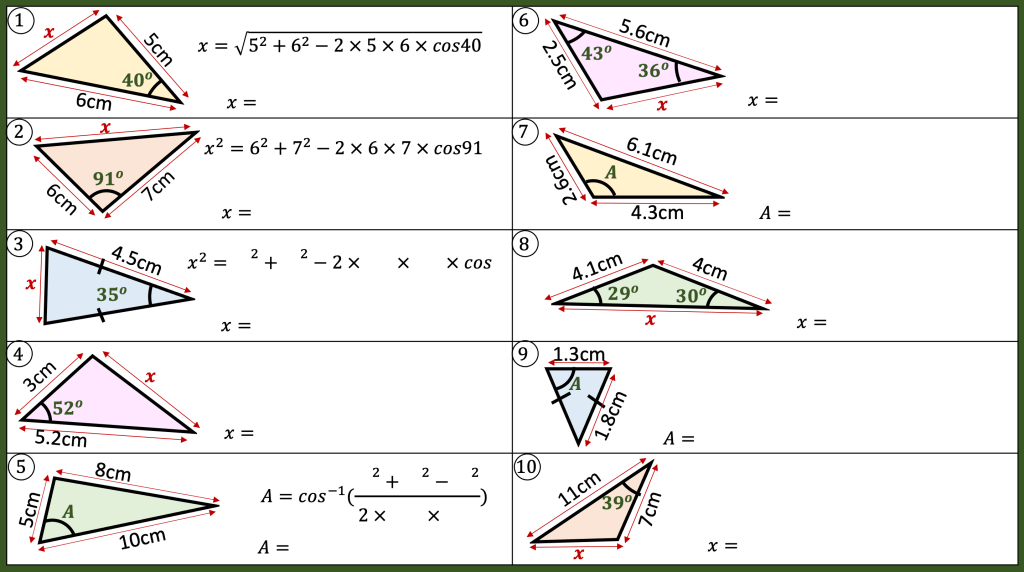
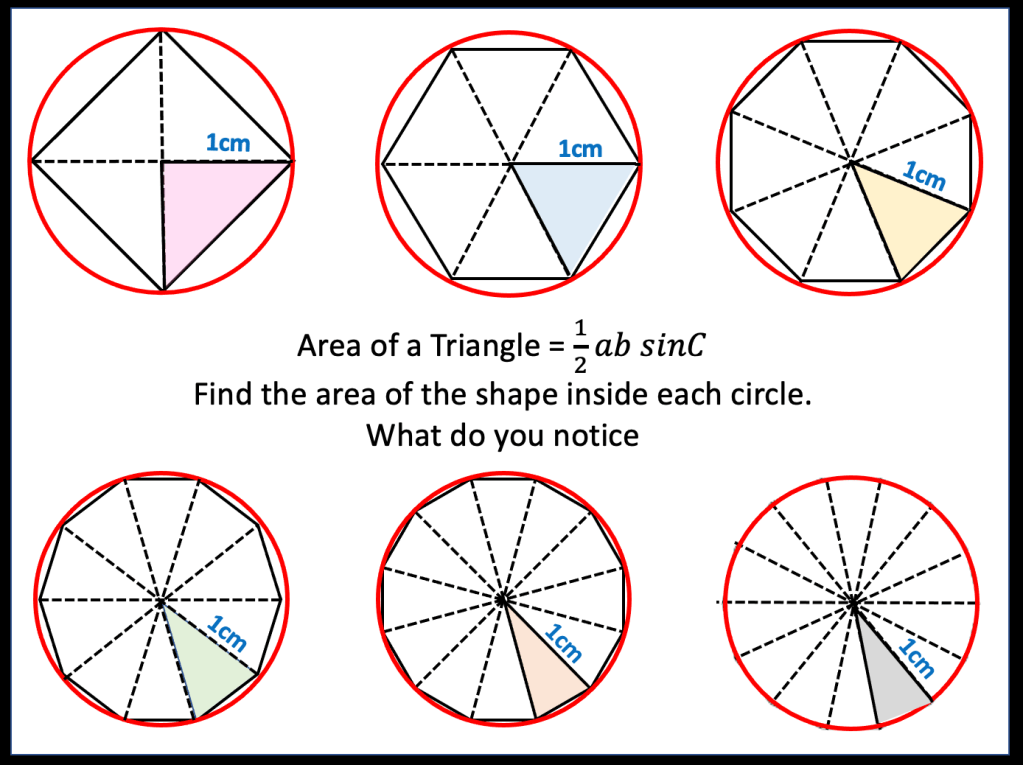
Area of a triangle
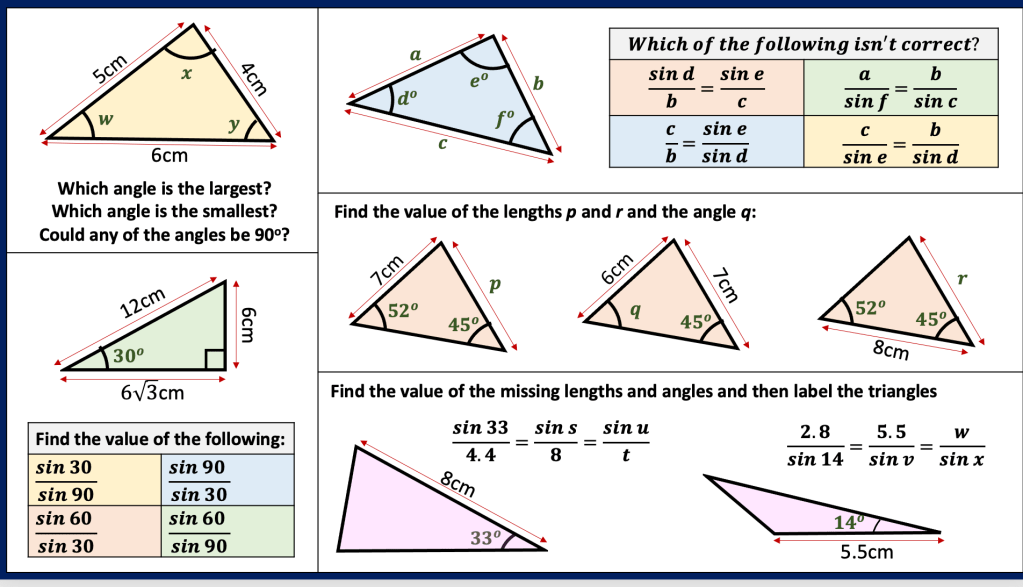
Sine rule

Cosine Rule
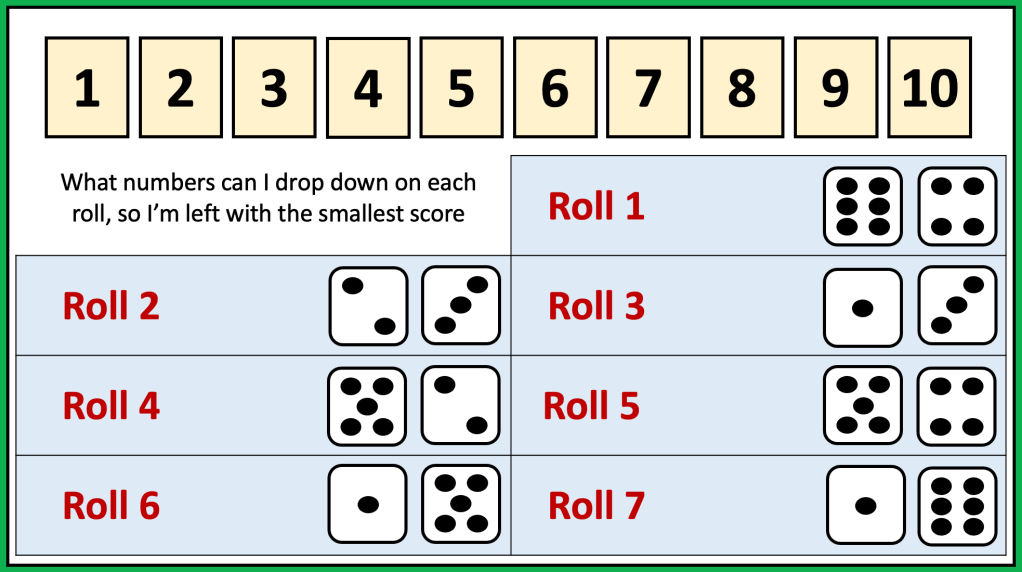
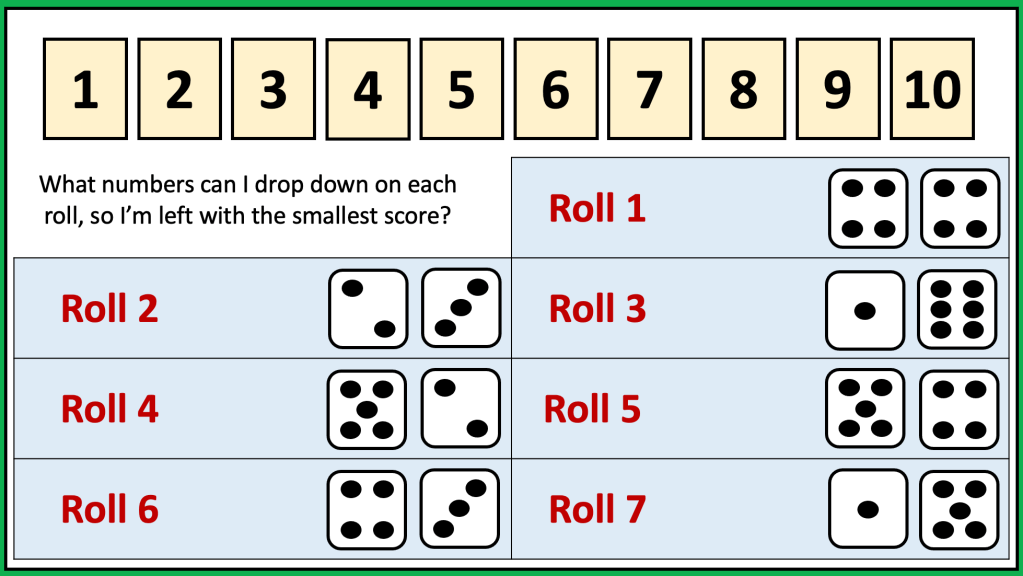
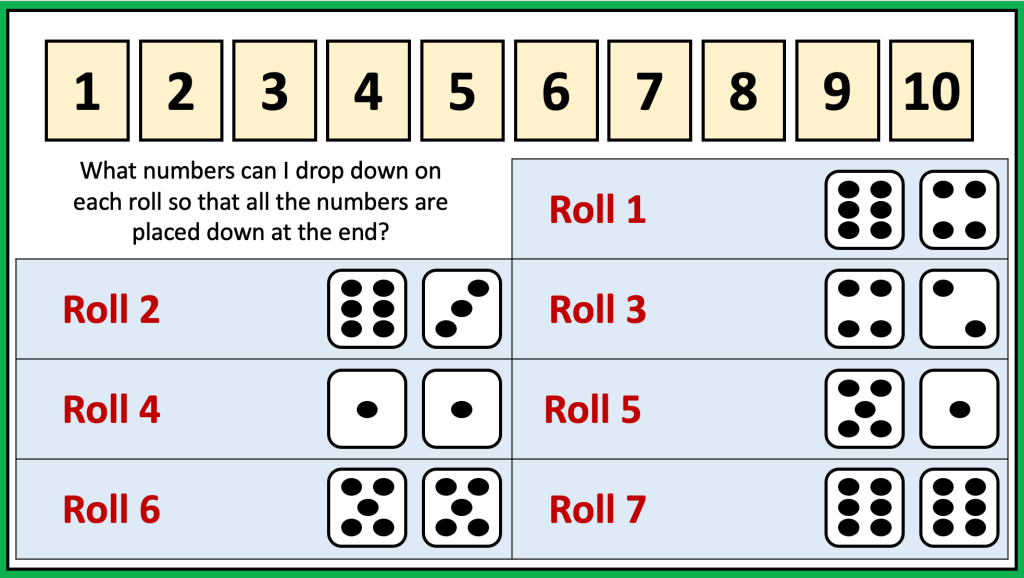
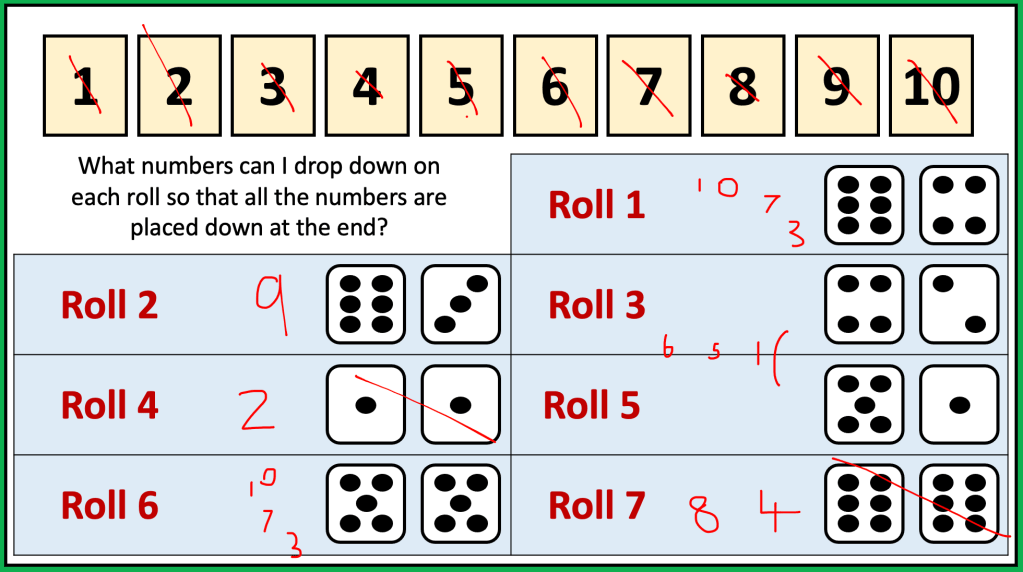
I have loved playing Shut the Box this past year so wanted to make a classroom version (I could bring the actual game but wanted to do a quick version that involved the whole class at the start of a lesson)
The idea of this task is students can all join in with the same task
I roll two dice, they total the dice and either cross out one number or two numbers that have the same total.
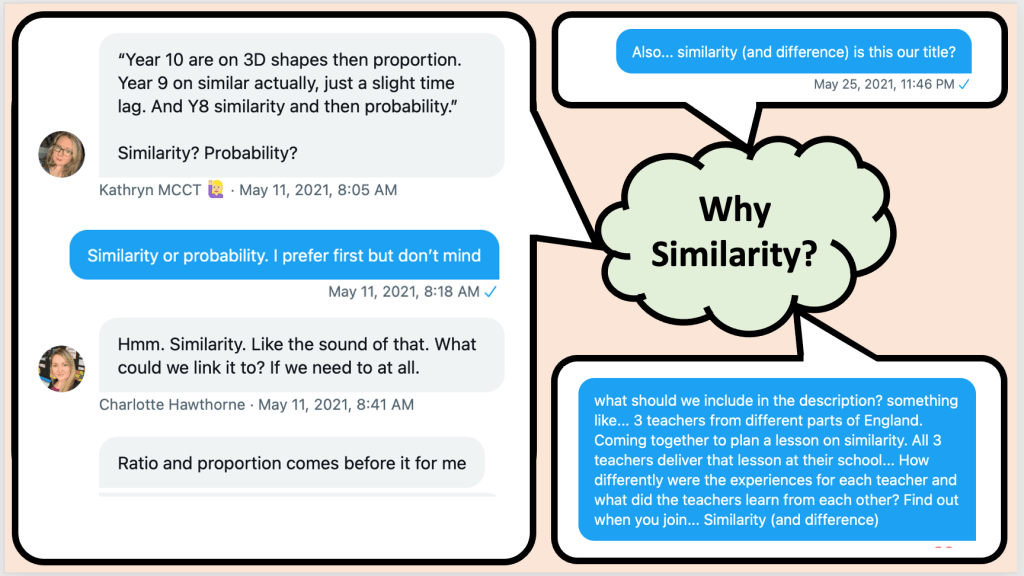
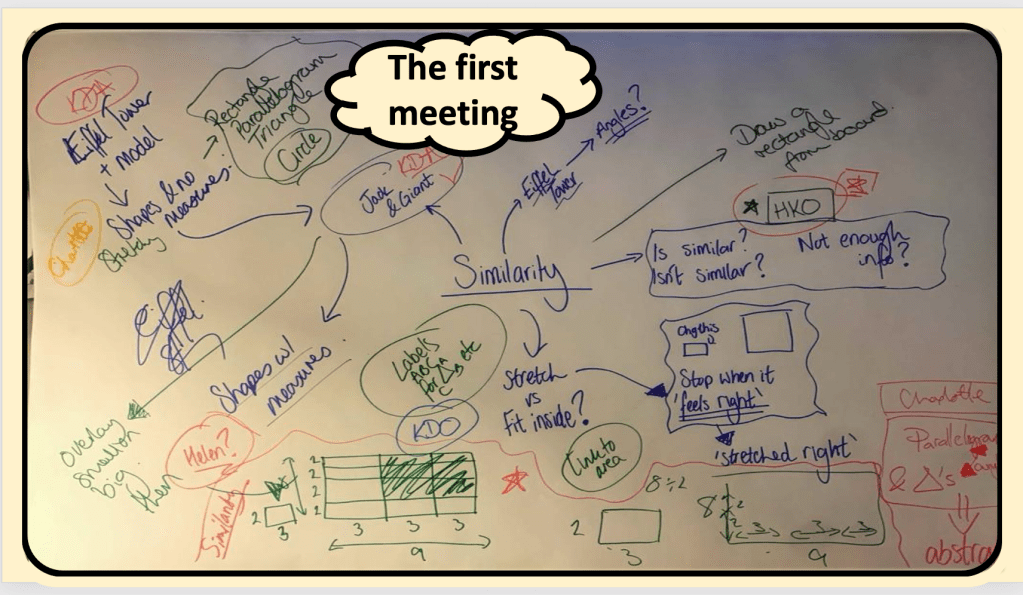
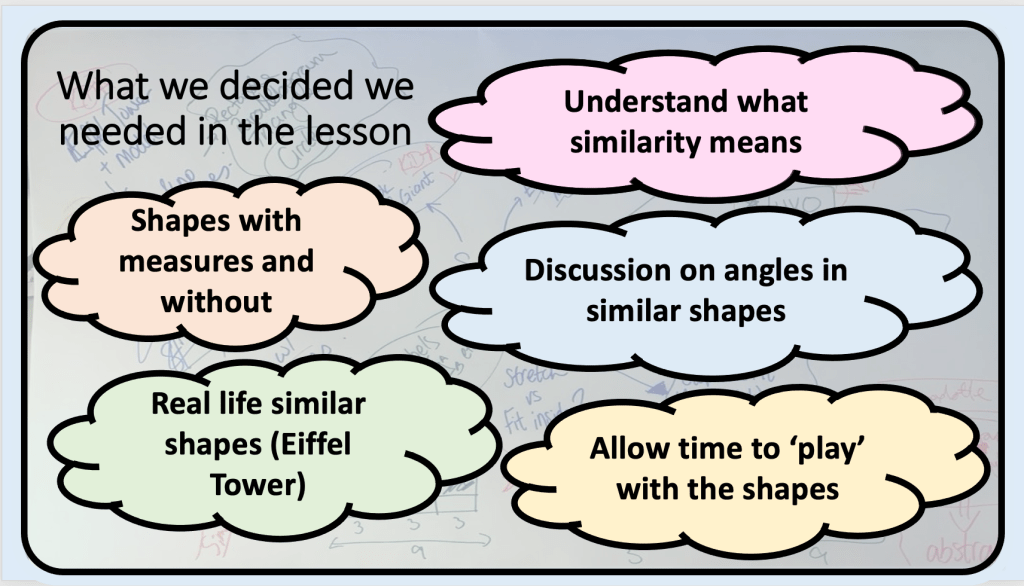
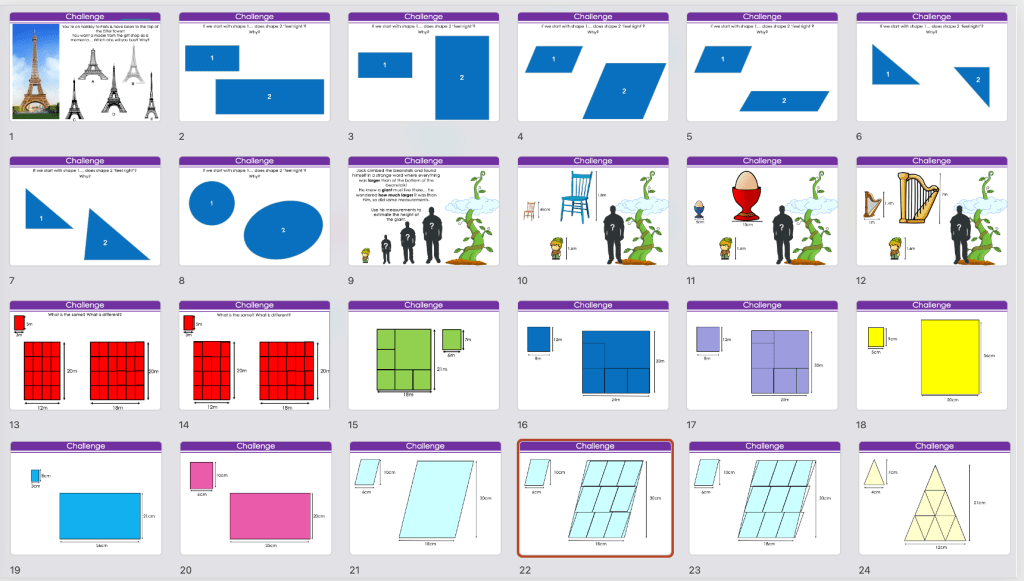
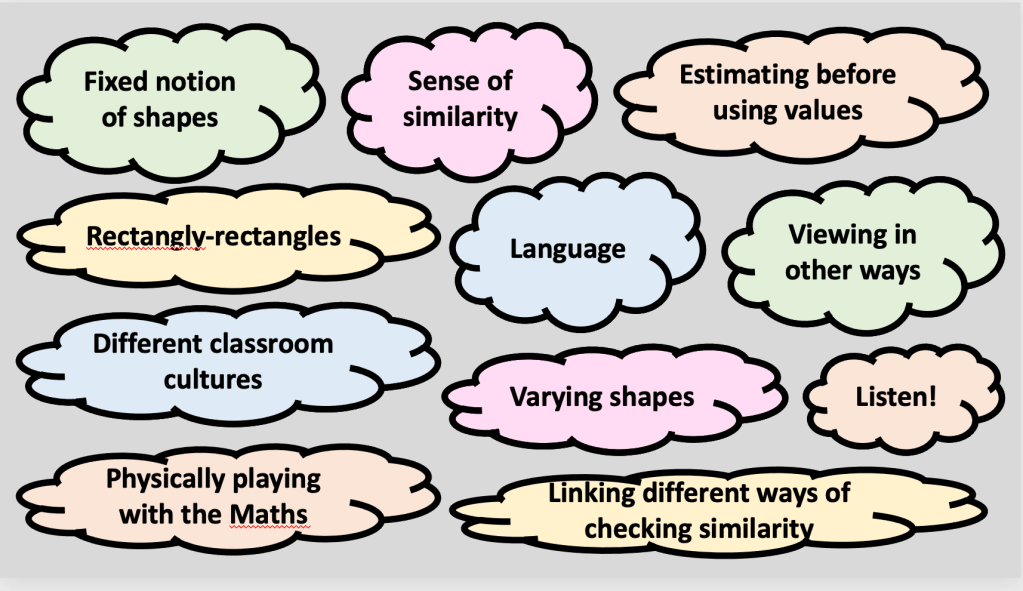
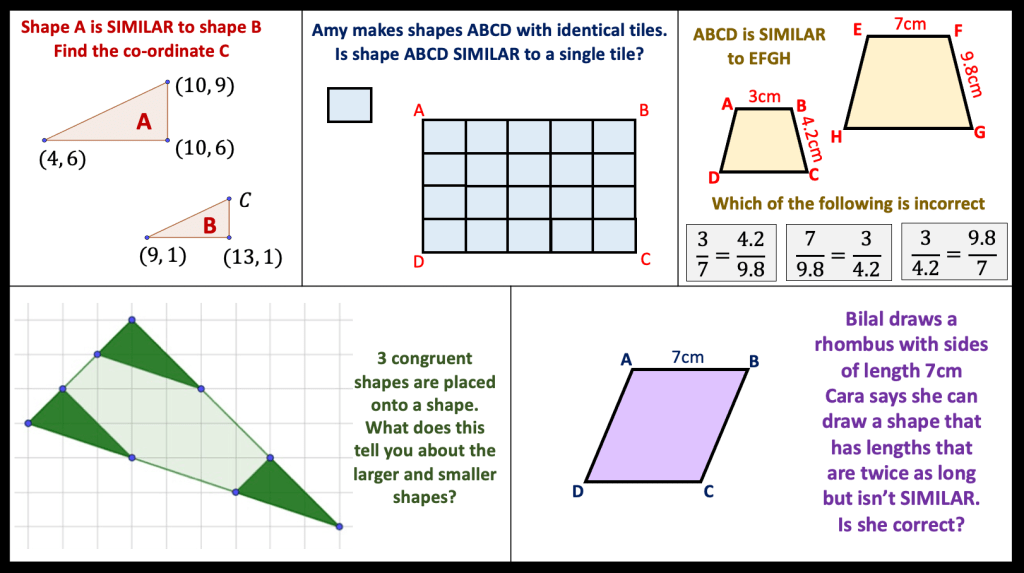
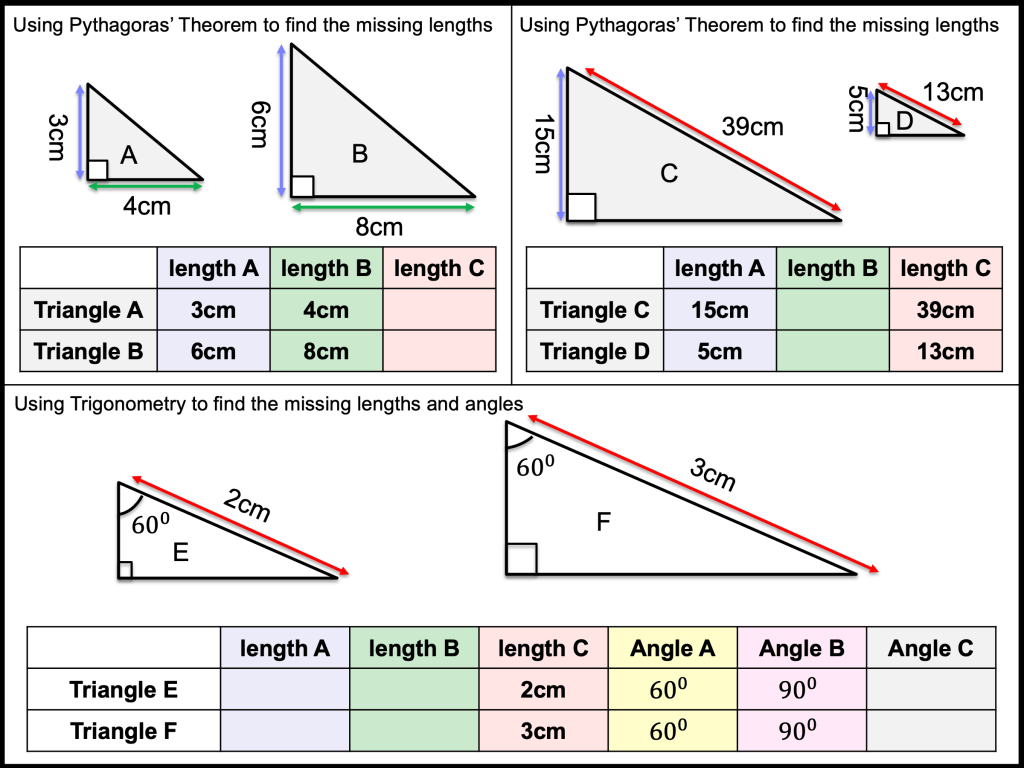
Kathryn Darwin and Charlotte Hawthorne and I decided to jointly deliver a workshop at mathsconf. We wanted to choose a topic, collaboratively plan a lesson and then after delivering the lesson, we would discuss it. Below are the slides from mathsconf26 and some of the tasks.