Recurring and Terminating Decimals

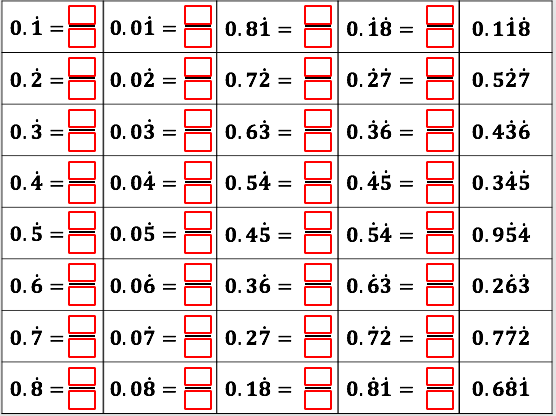
I have been teaching Recurring and Terminating Decimals to year 9 this week and last week. I started off with the task below at the end of this post and it was written several years ago but is still a useful task. The second lesson was when I wanted students to be able to convert a recurring decimal into a fraction. I started off with 0.4 recurring, 0.5 recurring etc. The students could quickly see that these all had a denominator of 9 and when two values recurred, they saw the denominator was 99. I proved this and everyone was happy, but then I showed them a question where some of the numbers terminated and then it recurred. They struggled with this and didn’t notice the pattern i’d hoped they’d see in the sheet below: I hoped they would see that 0.1 recurring was ten times bigger than 0.01recurring so 1/9 could be divided by 10 and so 0.01recurring was equal to 1/90. So I realised we needed to spend longer on this in the next lesson.

Screen Shot 2020-01-13 at 21.28.05

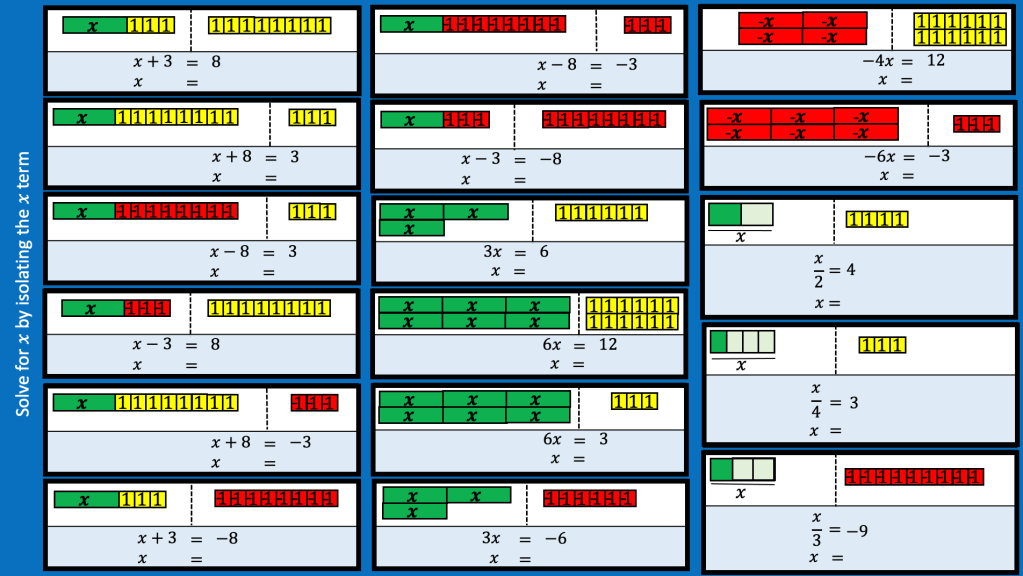
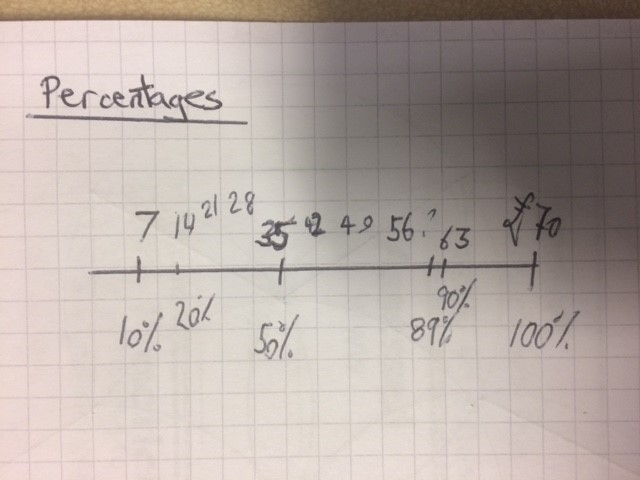
The plan for the next lesson is to start with the slide below as a recap of the previous lesson. The questions are connected so I would like to spend some time discussing how they are related.

Screen Shot 2020-01-13 at 20.32.38

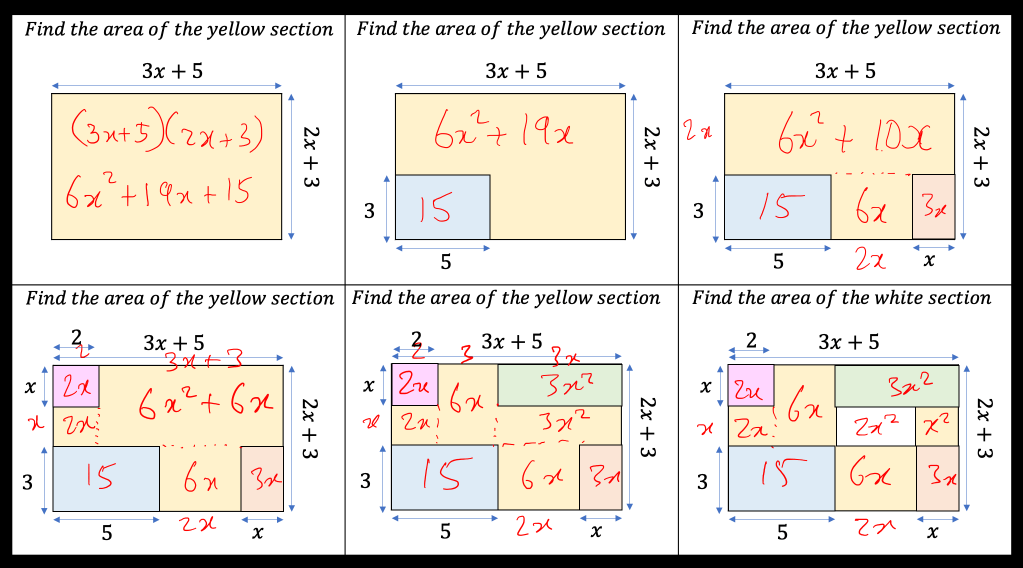
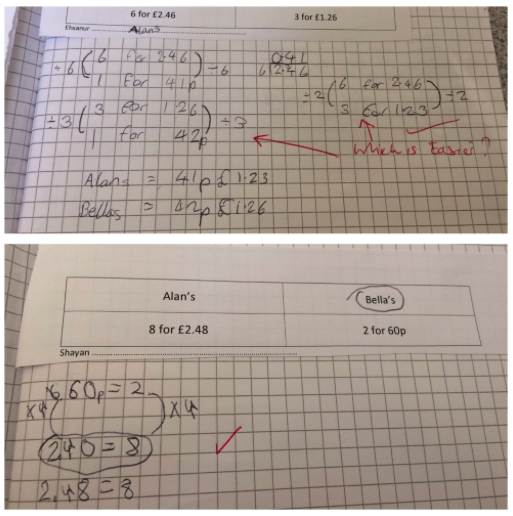
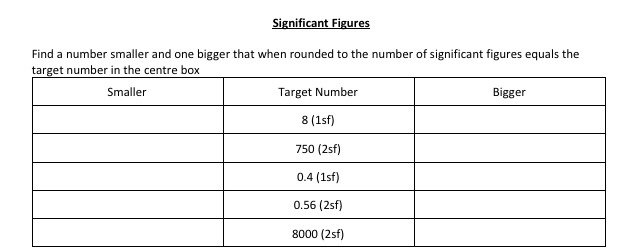
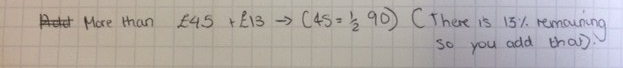
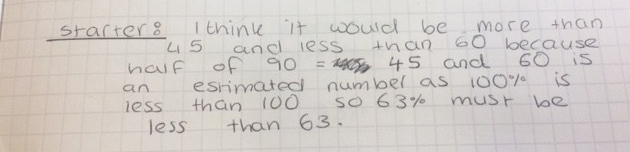
Then I want to look at the problem below and usually I would look at the approach in the middle but I am unsure if its worth looking at the blue method. I guess what is worrying me is that the class aren’t as fluent with fractions as I’d hoped so they would struggle to see the connections. I think I will teach the middle method and then see if they can understand what is happening at each stage in the other methods. Screen Shot 2020-01-13 at 21.19.28Screen Shot 2020-01-13 at 21.19.36Recurring Deicmals

Written in 2017:

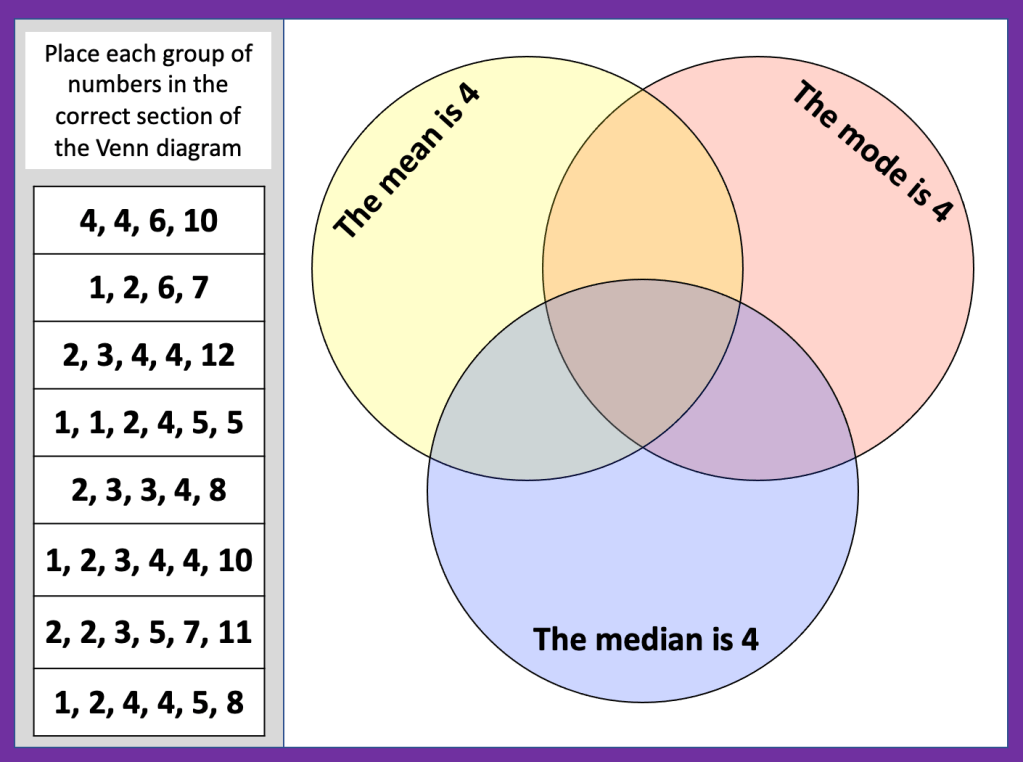
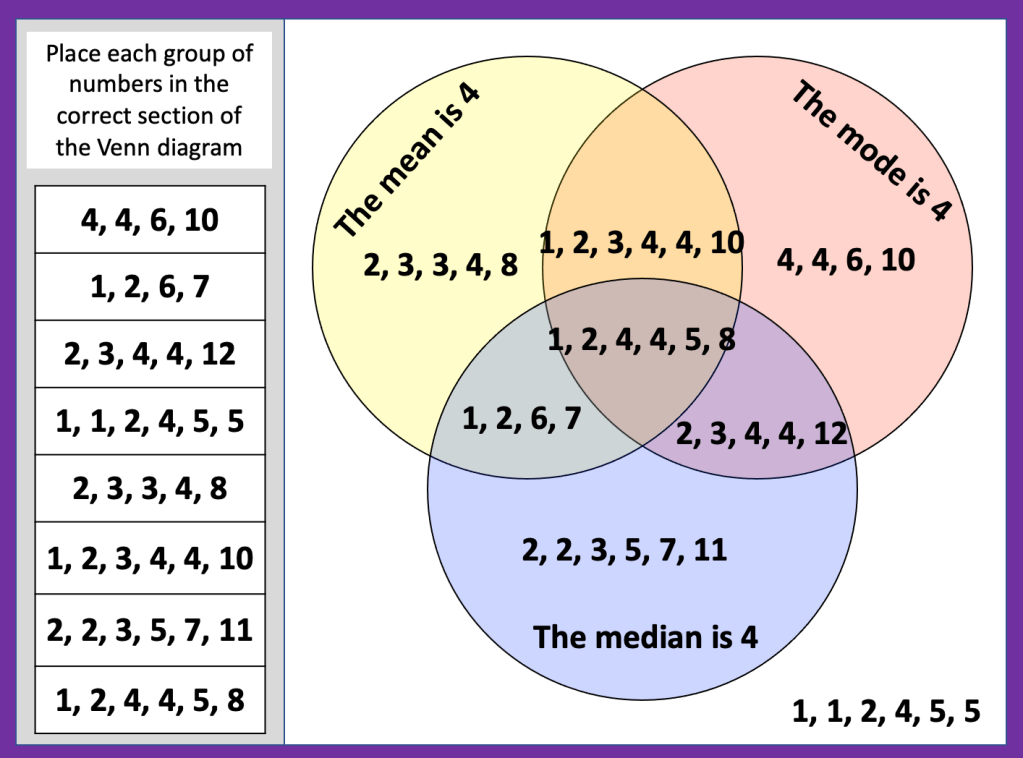
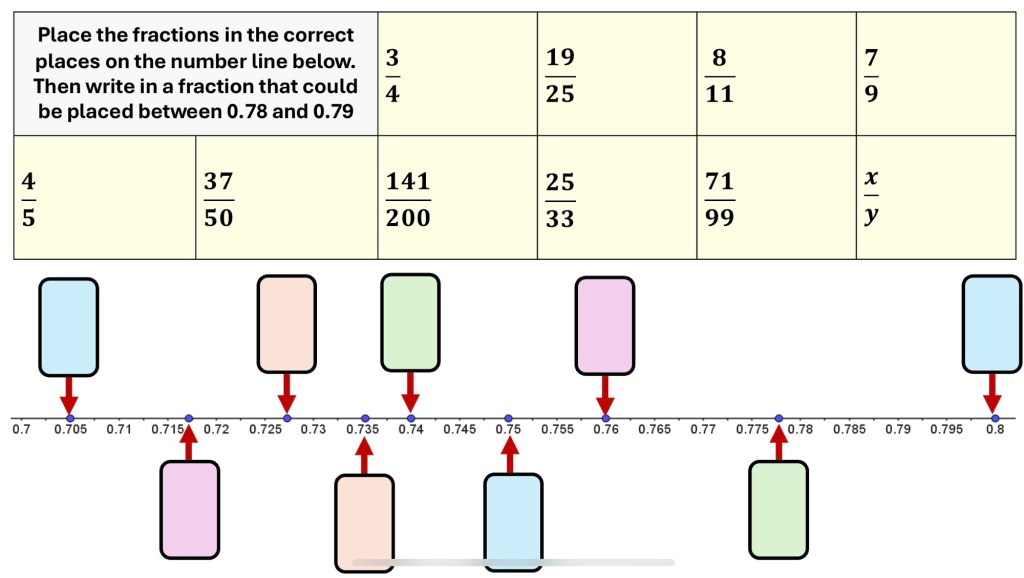
I made this task because i thought students would enjoy trying to find a way of fitting the fractions into the table. I initially came up with the tables and had an idea that i would ask students to find fractions that fit, but then I thought they might just add in easy fractions they knew such as 1/3 and 1/2 but in hindsight i don’t think they would have been as quick to find the fractions and it might have been a better challenge for them to try and find the fractions themselves.

Screen Shot 2017-09-24 at 18.25.05

I then gave them a range of fractions that needed to be placed in the table, this might work better with some groups.

Screen Shot 2017-09-24 at 18.25.11

but i think with a group that relish a challenge i wouldn’t supply the fractions, or maybe you could give the option of trying to find fractions that fit the table and put up the fractions above if they get stuck. Its important that students know they are finding fractions that equal decimals that fill the criteria

Terminating and Recurring Decimals


Error Intervals

I’m about to teach upper and lower bounds after spending sometime teaching significant figures and estimation. I gave a task to my class during the lesson on SF that I realised is a good task to precede the bounds topic.

What was nice about this task that wasn’t apparent until I had given it and students (in my set 1 year 8) were trying it, was how much it encouraged students to discuss the range of possible answers. When we working through the answers, students were offering up their differing answers and then other students were commenting on whether they would round to the value required. After a few questions, students started saying ‘you can have any number between… and….’

this will make a nice opening for bounds next lesson.

Percentages of Amounts

When I am following a SOW, the percentage topic usually follows fractions and decimals but this year I have been following the SOW for year 10 and it’s placed in the Ratio and Proportion unit which makes a lot of sense. Obviously topics interconnect and it’s placing could easily be in more than one location but I have enjoyed teaching it in this unit. After spending weeks looking at ratio tables it makes it easier to look at questions like;

If 10% is £30

7% is ….

Students are able to think about finding 1% or they can simply see the connection that the amount is 3 times bigger than the percentage. Which is the same as finding 1% but is a much nicer way of seeing this particular question. I used these percentage spiders (taken from Don Steward site) in the lesson and students very quickly used proportional reasoning to find all the missing percentages. One student commented on the fact you could find all percentages from just 1% 10% and 50% and we all agreed these were very easy to find even with ‘tricky’ numbers.

The next step from this was to try and find percentages that looked tricky but once they were broken up were easy to find. I was surprised by how many in my set 3 who worked through the table and were fine with 10%, 5% and 1% but then struggled with 6% and 111%. Even though the top half of the table had percentages useful to calculate 6% and 111% we did spend a great deal of time before they attempted this table looking at how we could find 9% or 11% or 15% or any other percentage they deemed ‘tricky’

The colours used on the table were just to highlight the percentages that i thought wouldn’t cause a problem (red) and then green for the more challenging ones.

At the end of this lesson we looked at the following problem;

Which is bigger:

14% of 50 Or 50% of 14

8% of 10 Or 10% of 8

I only wrote two in the hope that students (after finding that both were equal in each set) would try a few of their own to see if they were also equal.

Percentages

UPDATE! After tweeting this link i received the following reply

Screen Shot 2017-09-26 at 20.28.57.png

The next lesson, I asked the class to estimate 63% of £90. I was pleased that they didn’t just try and calculate 63% but actually tried to estimate the answer. Some just gave numbers that sounded appropriate but when questioned they said they had just guessed at a number between 0 and £90. I asked of they could narrow their ‘guesses’ at all and one said it has to be more than £45 as ‘£45 is halfway’ Then someone suggested £54 as 10% was £9 and so 60% was 9 x 6. When i showed each of the estimations prof Smudge suggested they were fine explaining the first two but when it came to the second two estimations they started doing some strange things.

IMG_4726

IMG_4735IMG_4730

I decided that in the next lesson i’d like to tackle this misconception and so i made the following starter to use.

Screen Shot 2017-09-26 at 20.58.37

UPDATE!

Students quickly realised with this problem that Ali either; subtracted 11% from 89% and probably subtracted £11 from £70 or he subtracted £30 from 89 as there was a 30% difference between 70 and 100%. The fact both ways resulted in £59 confirmed the thinking. I gave students time to add in any other marks they wanted on the line. Some added in multiples of 10% and some used 1%.

per

One student did make a comment that if 10% is £7 then 1% cant be £4 and that is how much is needed to get from £63 to £59. The rest of the class took a while to notice this and fully understand it. It made me realise that students didn’t always realise that if 4% is £3 then 8% is £6 so maybe they needed to view them in a ratio table. Likewise if 10% is £30 then 7% is £21 because the amount is 3 times the percentage so again a ratio table would help. I made the following starter for the next lesson.

Percentages (proportional)

per1Update

i was pleased to see lots of methods being used and sometimes two methods to check answers or methods changing to suit the question.

Screen Shot 2018-11-26 at 20.24.33.png

I am trying this with some of my classes. I’m hoping it will provoke some discussions on percentages and MR

Here is another Question i will try tomorrow- very challenging but i want students to see that a 1% drop can’t be found by doing 10% decrease followed by a 9% increase.

percperc2

I have been wondering about Percentages and how I use values to help me ‘see’ the answer. I also tried sketching to get an idea of the answer.

PercentagesScreen Shot 2020-05-01 at 19.00.10Screen Shot 2020-05-01 at 19.00.03

Forming Expressions

There are some lovely ways of Forming Expressions. Students don’t always realise that Algebra isn’t just playing around with letters and that they don’t always have to use formal methods when forming expressions. I like tasks where students really understand how to deal with the letters and are comfortable forming expressions.

Screen Shot 2017-09-13 at 20.37.47.png

Whats nice about the task above is students are able to use numbers first and then apply the same process to letters. I constantly ask students to use a number example to help them. If they are struggling to form an expression for ‘Arun is N years old and if someone is 3 years younger’ for example, you can ask what they’d do if Arun was 10 or 6 or 4 etc. This can quickly be generalised. I don’t ask for the answers in the first two columns but just the calculation you would do.

Another activity I like to use enables students to use their ability to work with number calculations and then by changing one aspect of the problem, they try the same problem again. The first problem raising issues with order of operations and as it deals with money, students tend to find this association easier to deal with. Once they are happy with creating expressions with numbers (the answer isn’t important but students like to calculate them) you can verbally ask them what the expression would be (using the first questions as an example) for 6 days, 7 days, 8 days, n days or £40, £50, £n.Screen Shot 2017-09-13 at 20.56.18.pngScreen Shot 2017-09-13 at 20.56.38.png

I had a think about how i write expressions. I realise sometimes i use values if i have got mixed up with how to write the expression

Screen Shot 2019-03-26 at 21.39.41

I started with some values that students could try and see if they worked, then they could look at the generalised statements; is “Ali always older than Carrie?”

The final one: “Carrie is 11 years older than Ali?” Is it ever true?


Co-ordinates and Points on a Line

Students thought about the problem for a little while before they discussed it in pairs. I invited students to share their ideas and this is what they came up with the suggestions below.

df77df.png

I asked the students to explain the answers and they could use the grid on the visualiser to help. They came up and started marking on their points and realising one by one that the co-ordinates did not work. I then asked them to think a little bit longer about what the co-ordinates could be now they had a better idea of what we were/were not looking for

A students asked if they could mark a point on the line and say the co-ordinate and I said that was ok, so they quickly came up with (46.5, 11) so I asked if they could find anymore and they were trying to mark points between (45, 10) and (46.5, 11) but were not able to determine the co-ordinate.


Averages and Range

I like to use the following starter when I start teaching Averages and Range. Students can use words such as Mode, Median, Mean and Range if they want to at this stage but it is nice for them to have a visual (actual blocks have been used where needed) and an example to refer to later in the lesson. If a student is struggling to calculate the mean, they could be reminded of how you break up the towers and rebuild them as towers of equal height.

data

I find it easy to visualise all numbers as towers, even if i’m asked a question such as;

The scores on a recent Maths Test for a year 10 class are recorded and the mean is 24.4% for the class of 10 students.


Another Student joins the group, and the Mean is now 24%

What did this student score on the test?

I can imagine there are 10 towers of 24.4 blocks high. So there are 244 blocks in total. If the mean goes down to 24 blocks and there are 11 towers. We know there are 264 blocks. We can see there are 20 more blocks added so they scored 20%

Averages and Range 1

Averages and Range 2

Compound Measures

I have been looking at compound measure with year 11 this week and we have approached it using ratio tables. I like using ratio tables and i think it can make students think more logically about compound measures instead of substituting into formulae.

For example; I asked the class the following question…

I walk 2 kilometres and it takes me 15 minutes. At what speed do i travel at in km/h?

I had several students trying to draw a triangle and write S, D and T in the sections then try and divide 2 by 15.

Some tried to divide 2 by 0.25.

One student said ‘if you walk 2km in 15mins, you’ll walk 8km in an hour’

2 –> 15mins

… –> 1hour

This made sense to the class and we went from there. There was definitely a sense that the question and the process made more sense like this.

b

Speed: Here are two slides of the same questions but one uses images the other doesn’t. Could be used as a match up or could be used to support students if they need it. Here’s the ppt: Compound Measures (Proportion)

speed 2speed 1

Density: Here are 3 slides that have the same questions in various forms.

density 3density 2density 1

Pressure: And for Pressure…

pressure 2pressure 1

lesson 1 Pressure

lesson 2 Speed Distance Time

lesson 3 Density

UPDATE…

speed6

Speed Proportion

Compare

I like questions where students are asked to compare two options.  For example;

Screen Shot 2017-09-09 at 21.51.39.pngScreen Shot 2017-09-09 at 21.51.49.pngScreen Shot 2017-09-09 at 21.52.00.png

I like to see how students answer these questions. The reason i have 30 is because i gave each question out to a students and they answered it in their book. I was interested in how they approached it and if they had more than one approach, I was also interested if the person next to them could find a simpler way. Here is the worksheet with all 30 questions. Feel free to use them how you wish. I give each student one each or stick one in each book when i take their books in. I then mark their responses.

30 Compare Questions

Screen Shot 2017-09-09 at 21.55.13.png