Area of 2D shapes

I have started working on finding the area of 2D shapes with year 9 and I wanted them to see the connections with the area of a rectangle. Firstly because they are most confident with that shape but mostly because when given a formula they don’t remember the considerations that need to be made. For example; if they learn area of a triangle is 1/2 x b x h they don’t remember that you can’t just take 2 of the lengths as ‘b’ and ‘h’ unless they are the two lengths connected by a right angle.

Show a class an equilateral triangle with sides 6cm and if they calculate 1/2 x 6 x 6 then its time to reinforce the idea of a triangle being half a rectangle.

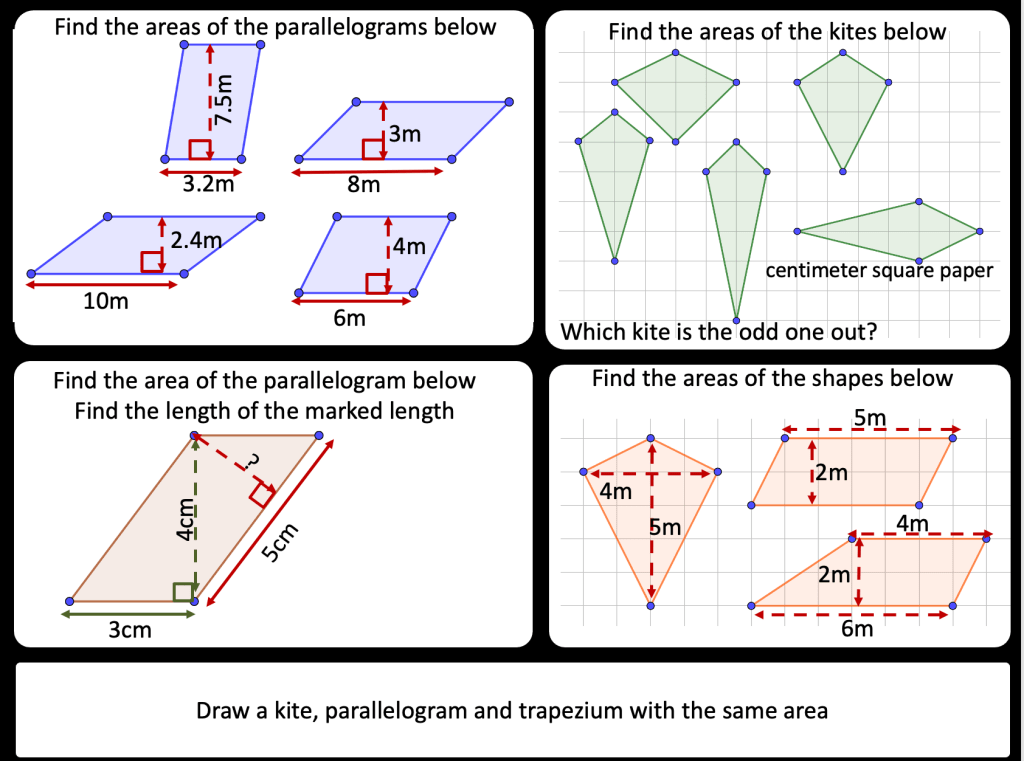
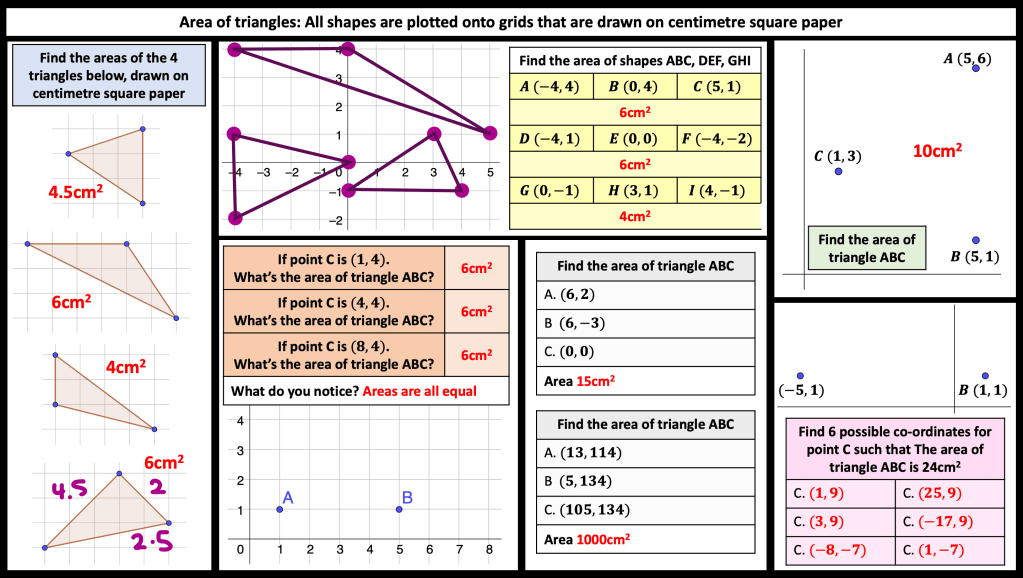
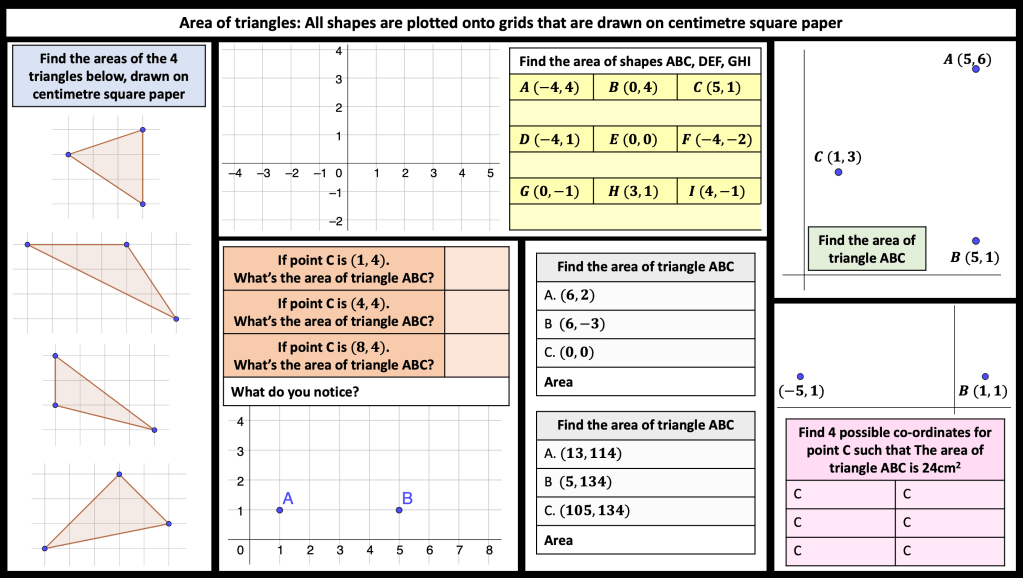
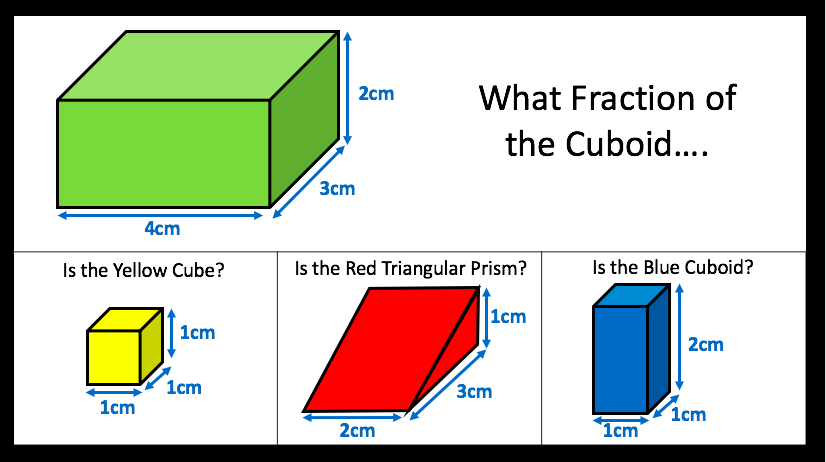
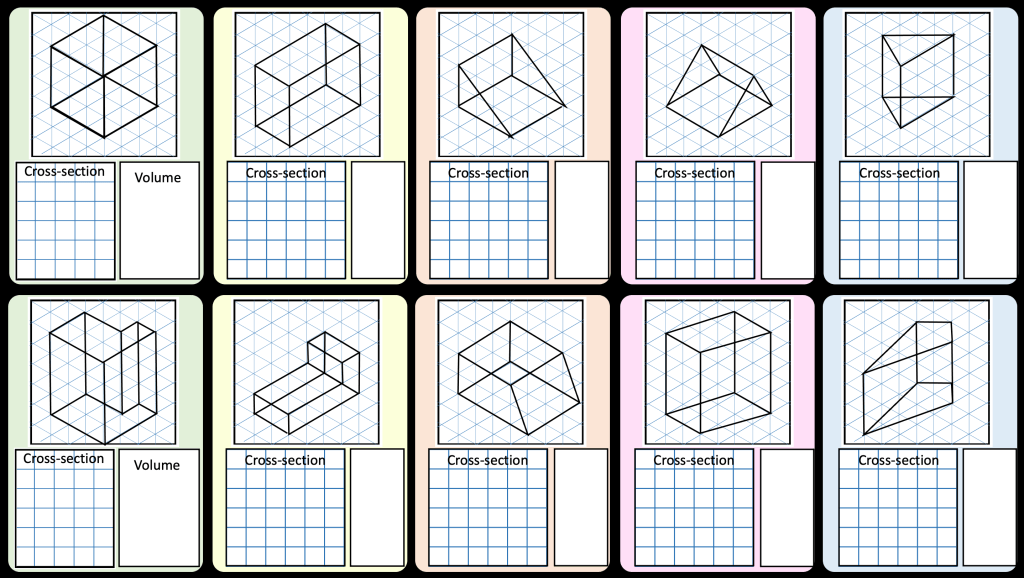
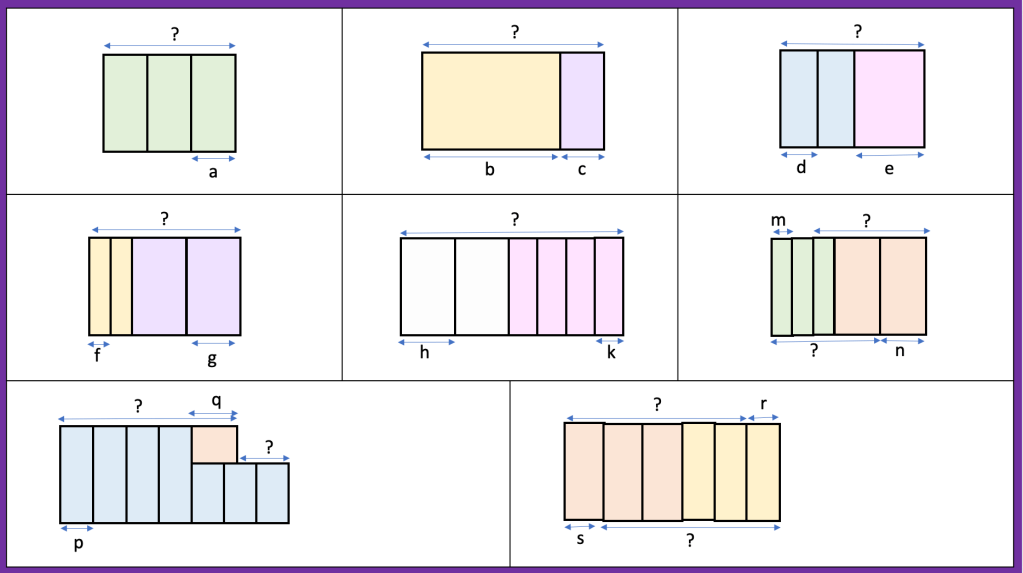
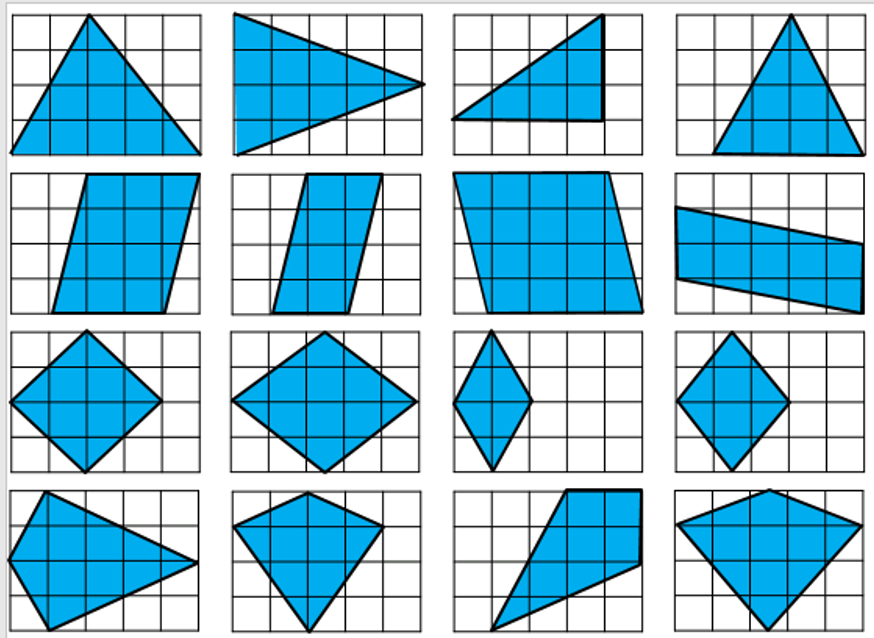
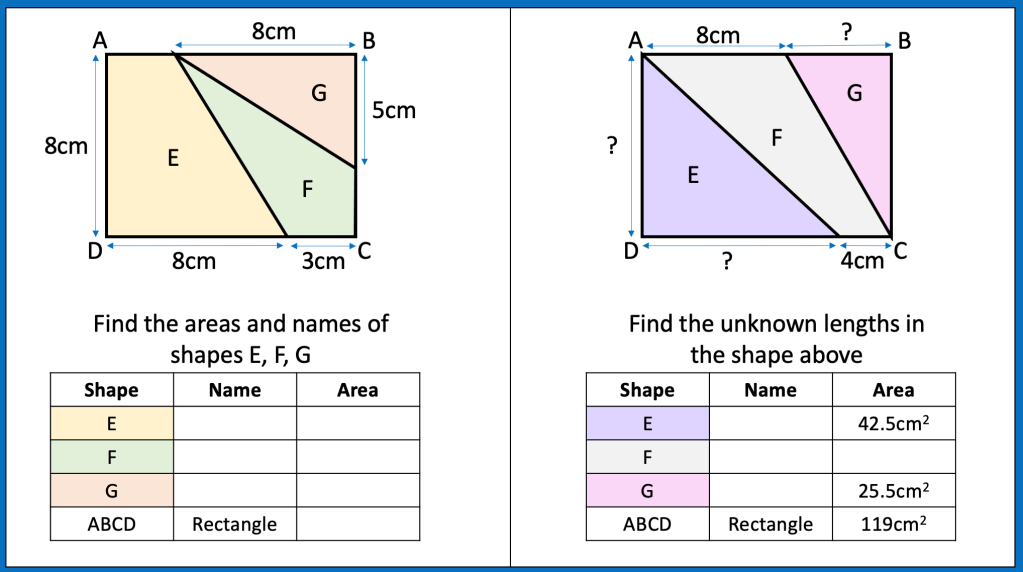
I plan to show my class the following images and ask them to find which shapes are half the rectangle, which are more and which are less.

shaded shapes

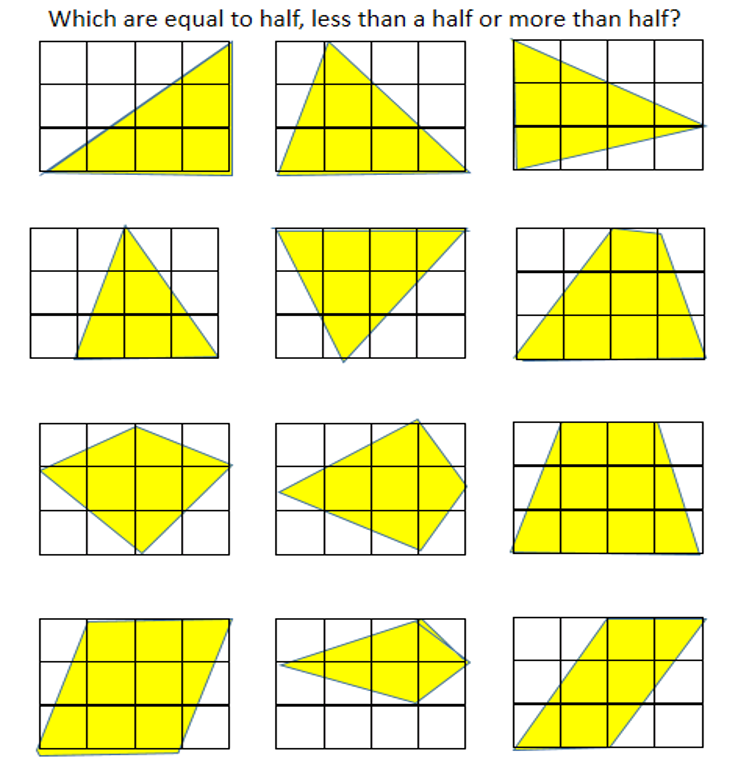
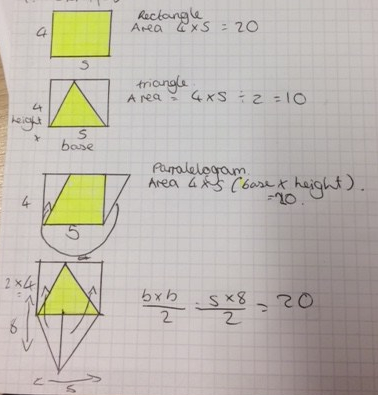
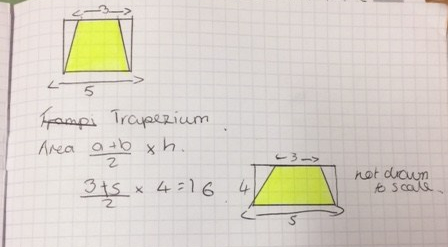
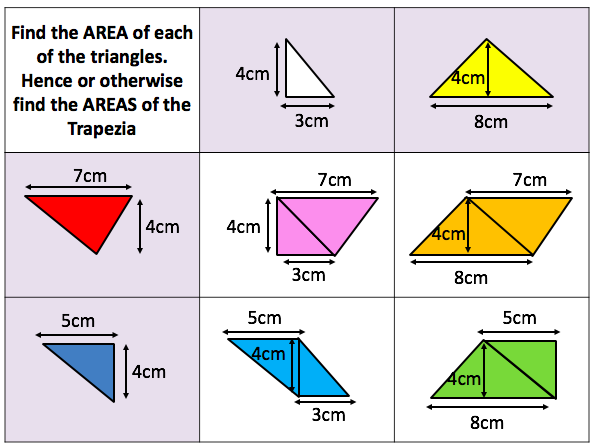
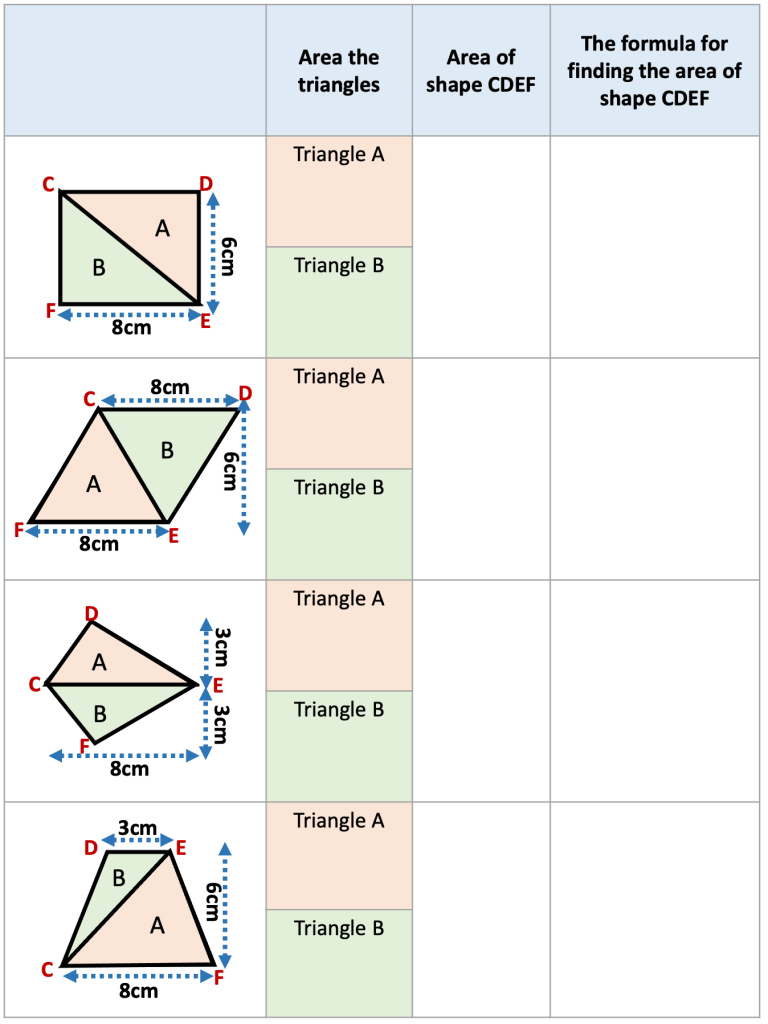
Then i plan to get students to try and derive the areas of triangles, parallelograms, kites and ultimately trapeziums from the rectangle. I have used a rectangle that i cut and reform to show this too.cut shapes

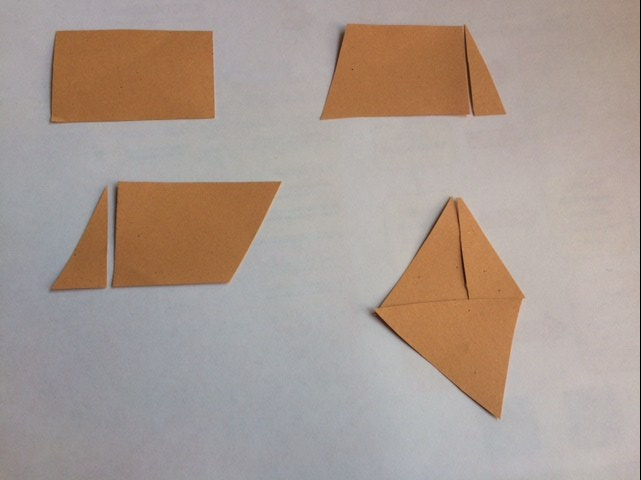
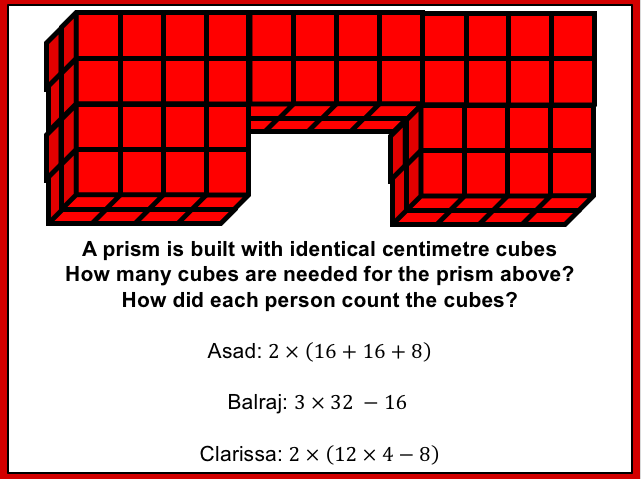
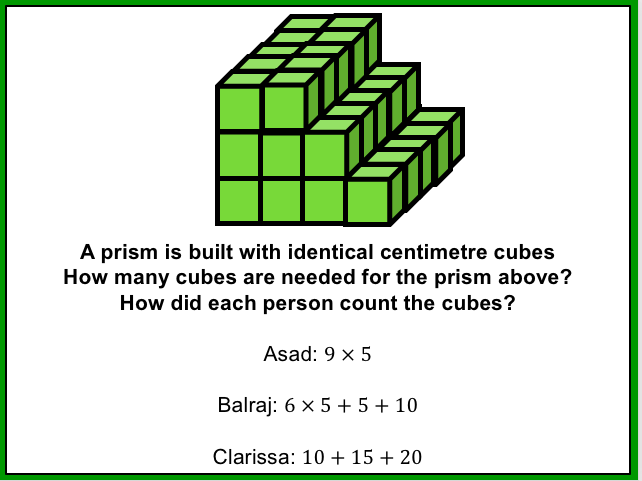
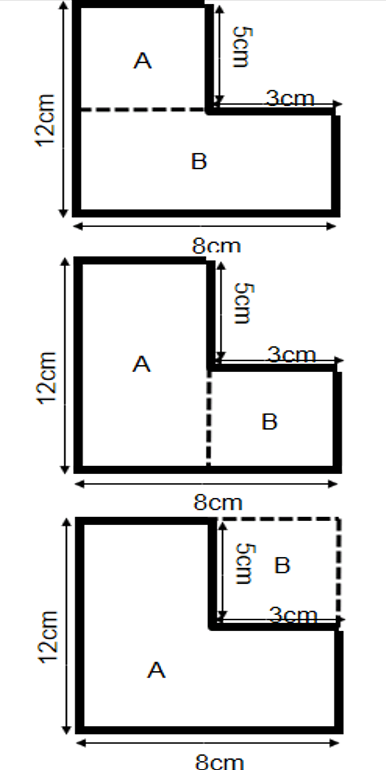
I have found with compound area involving rectangles that i give the same problem but split it differently each time. I ask the class to find the area of each and if they notice they are all the same shape each time then see if they can prove it 3 different ways.

compound shapes

shaded shapes

UPDATE!

IMG_6486

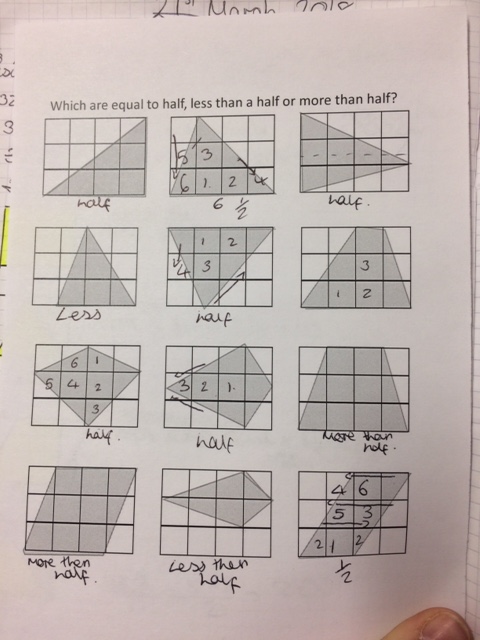
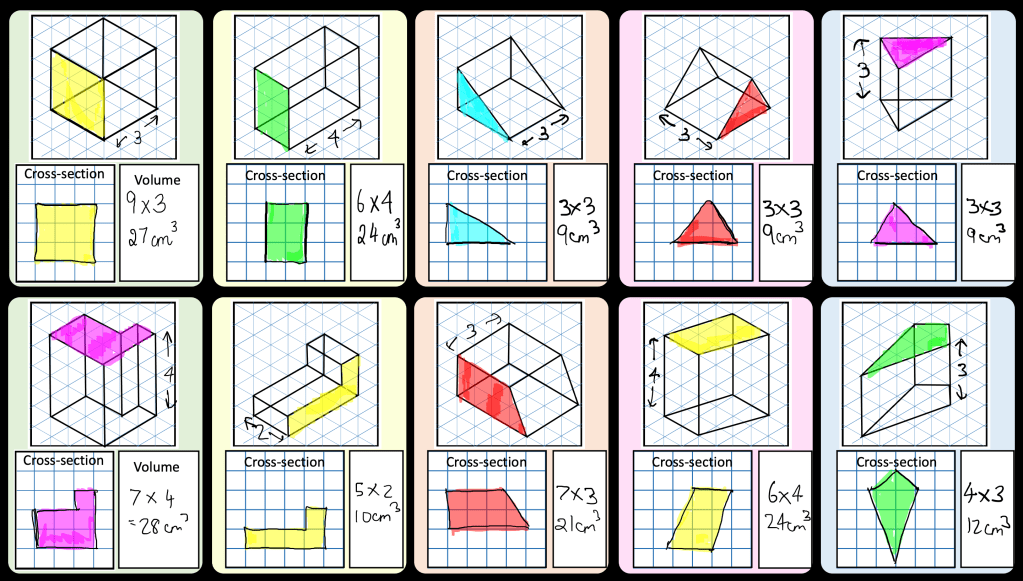
I was pleased that students imagined pieces moving or cut the shapes up in order to see if the shaded part was more, less or equal to a half.

We then derived the areas of other 2D shapes from the area of a rectangle.

img_6487.jpg

img_6488.jpg

UPDATE!

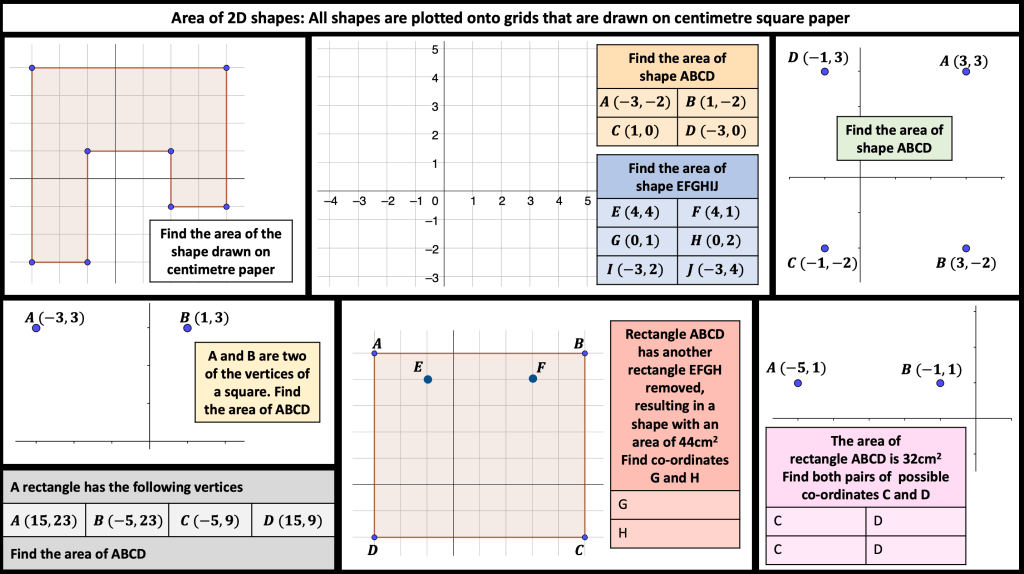
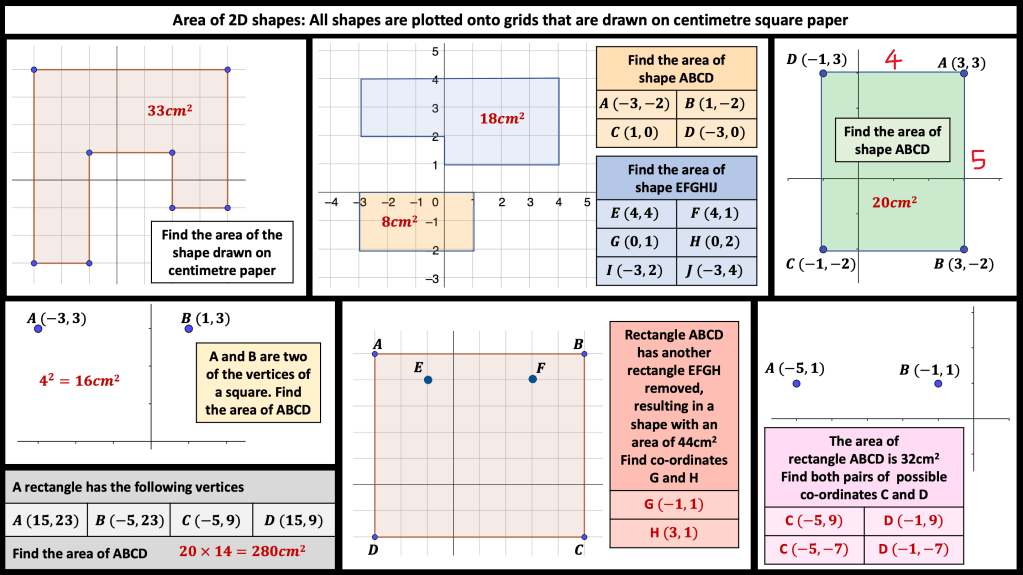
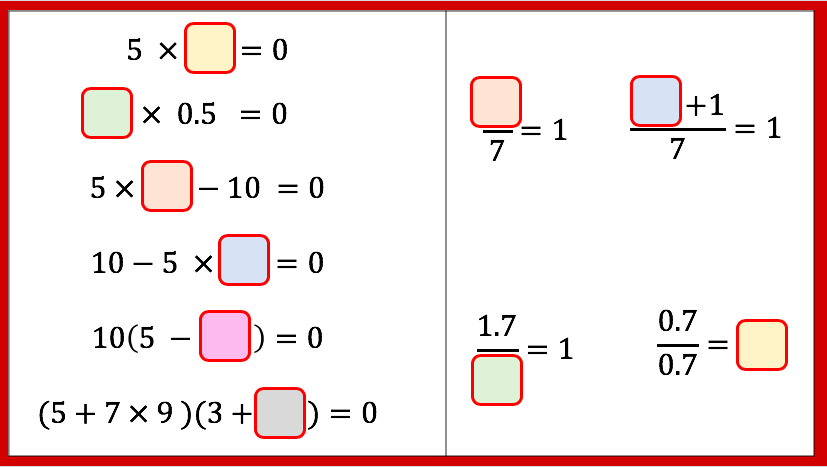
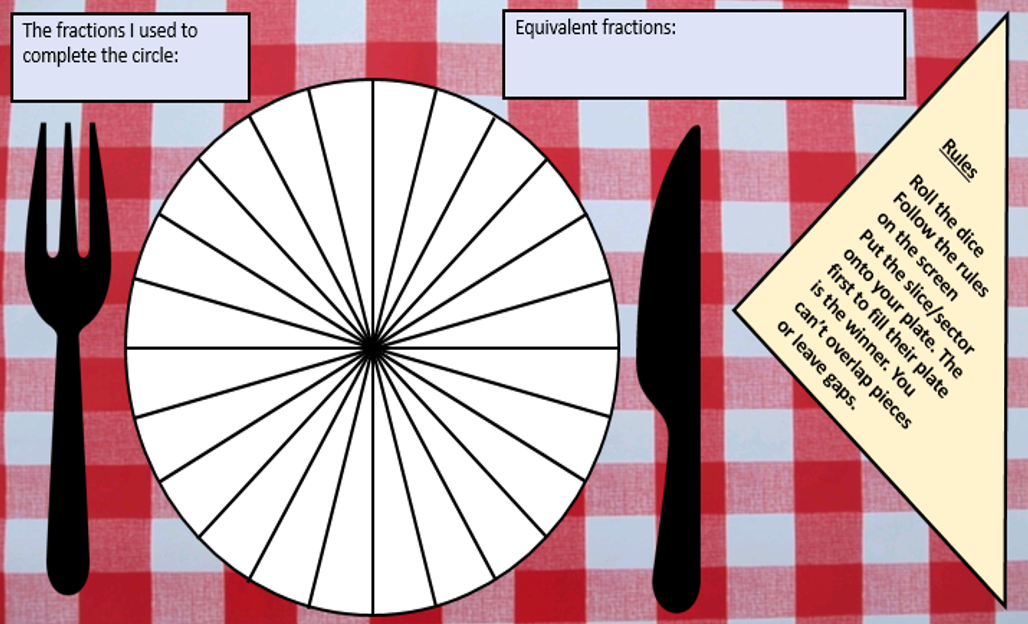
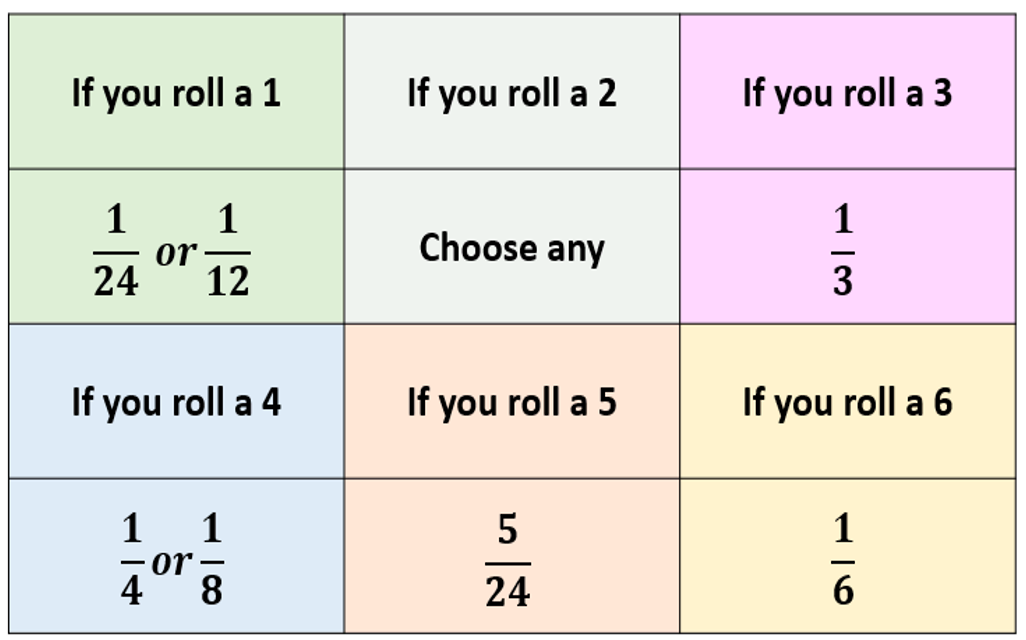
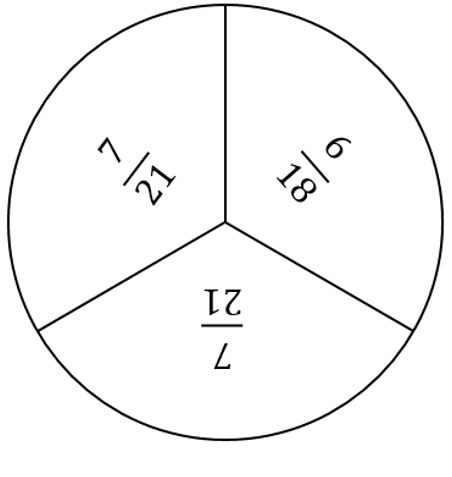
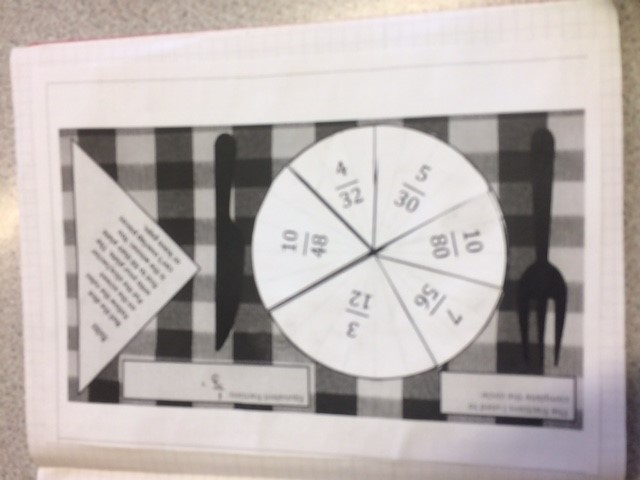
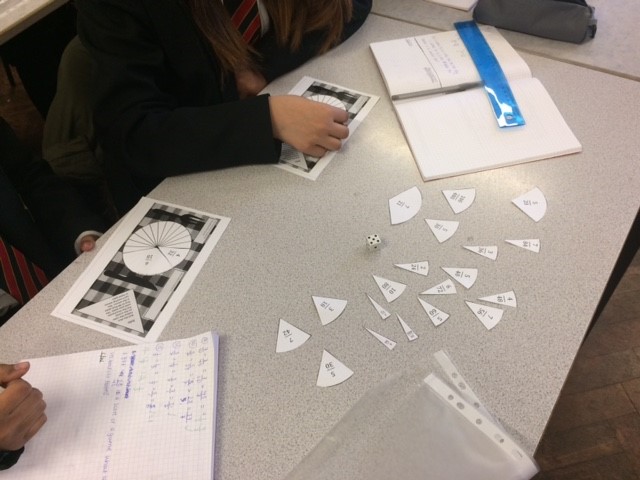
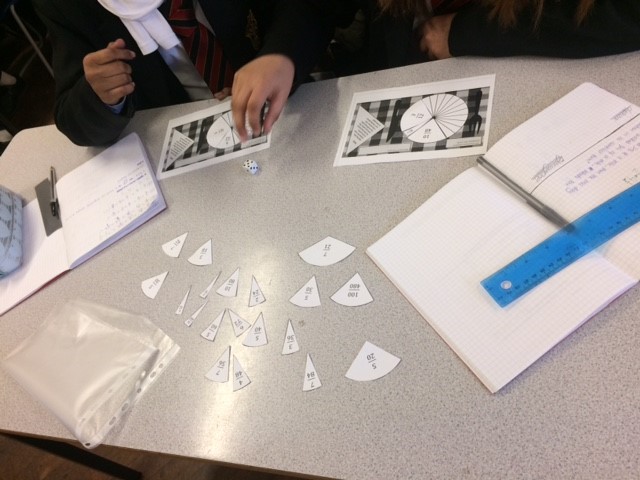
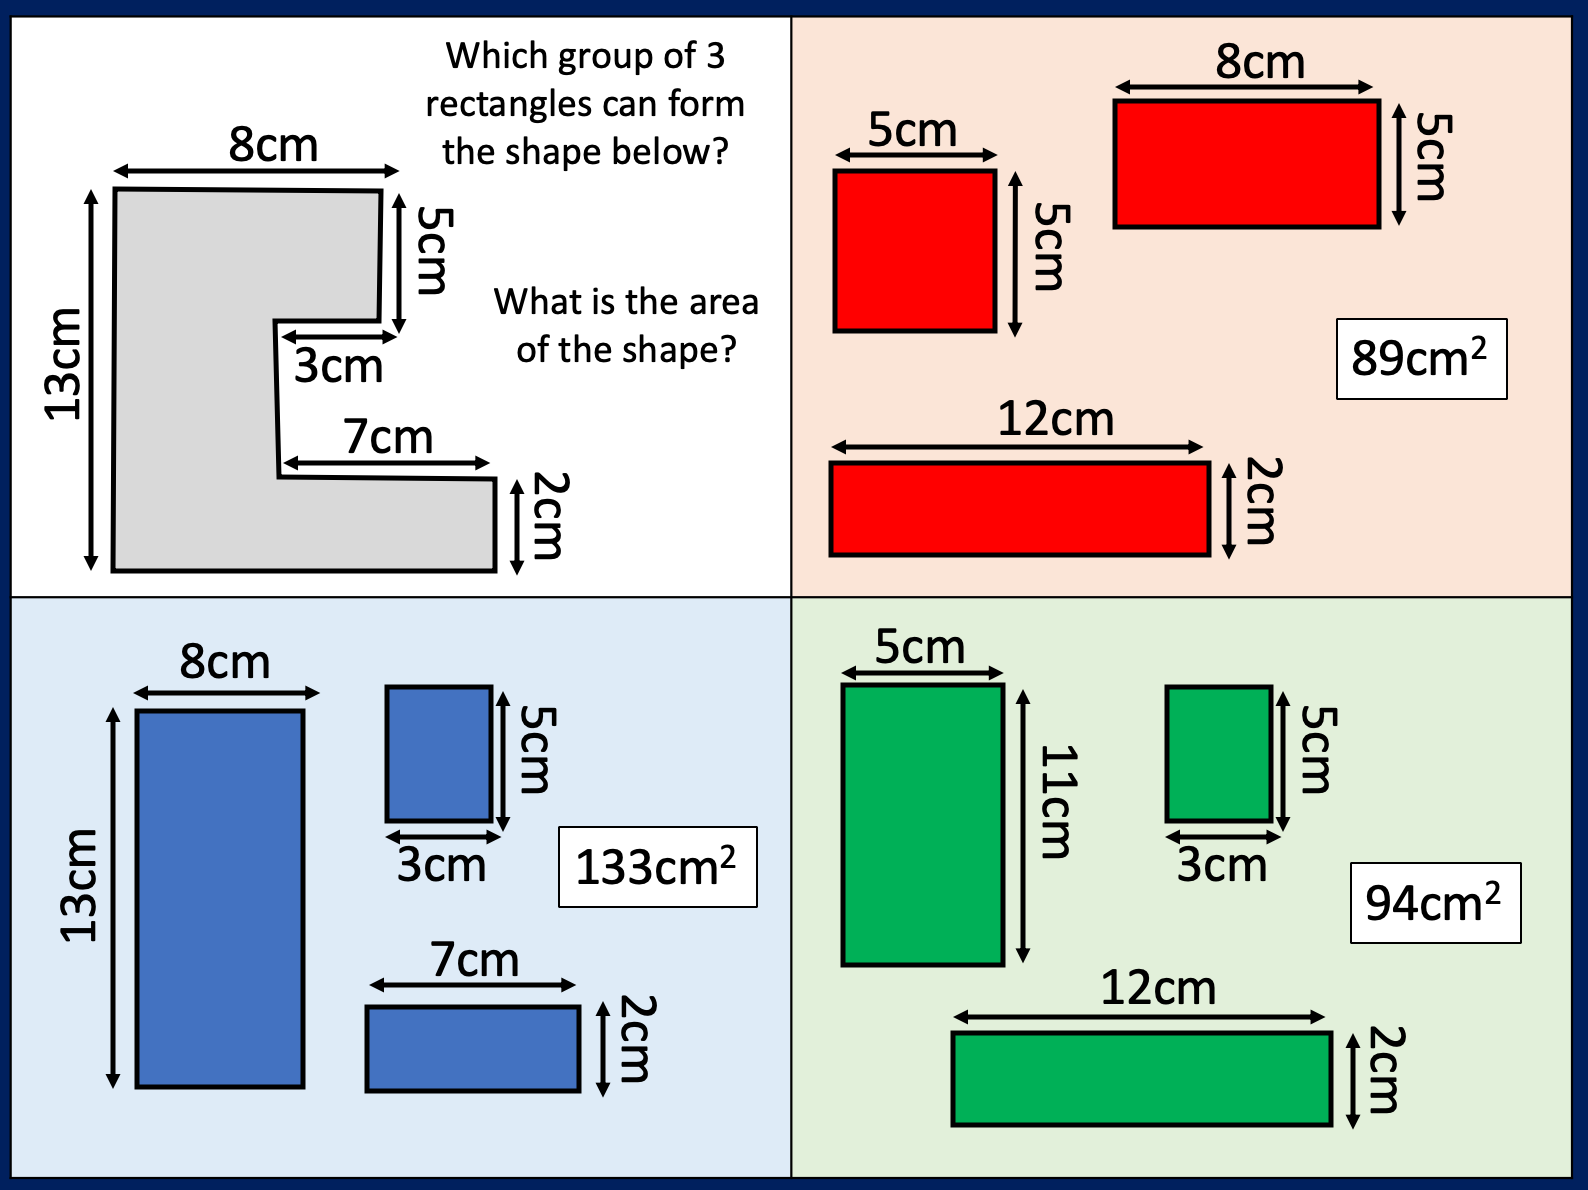
I made another similar task

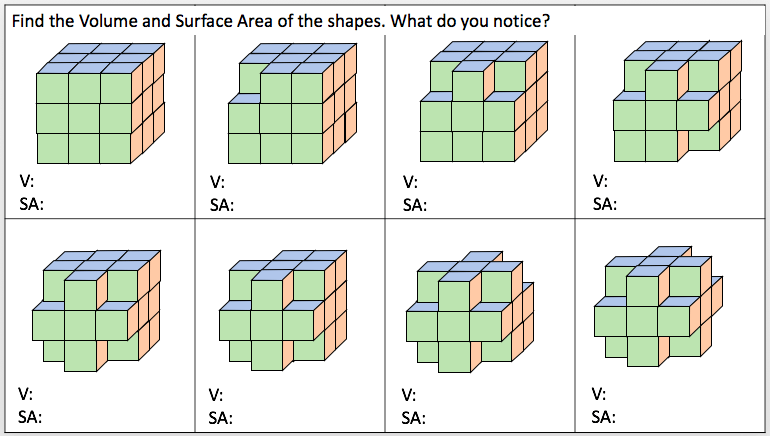
Students have to group the shapes so that the shapes in each group have the same area as one another.

2d

UPDATE:

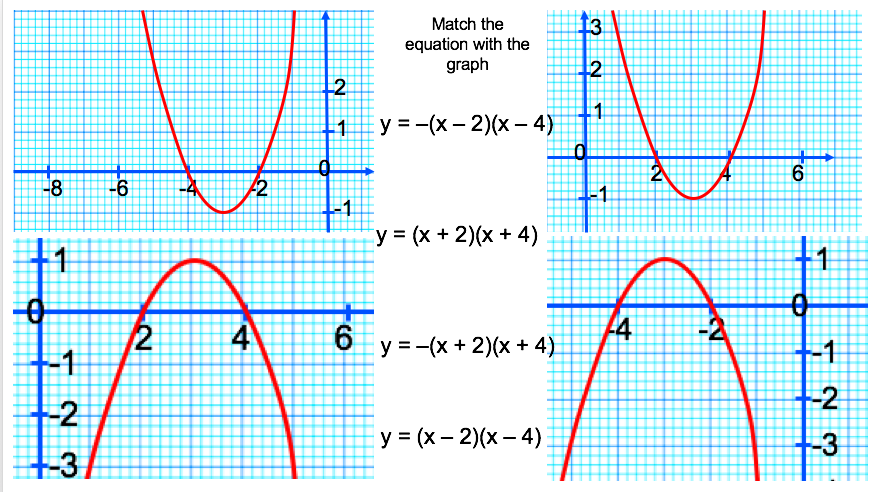
I’ve been rethinking some questions for 2D shapes. I want Ss to consider whether they should split or form a rectangle to find the area of compound shapes

Screen Shot 2020-02-13 at 22.58.49Screen Shot 2020-02-13 at 22.01.34

Screenshot 2020-06-11 at 23.35.26Screenshot 2020-06-11 at 23.35.33

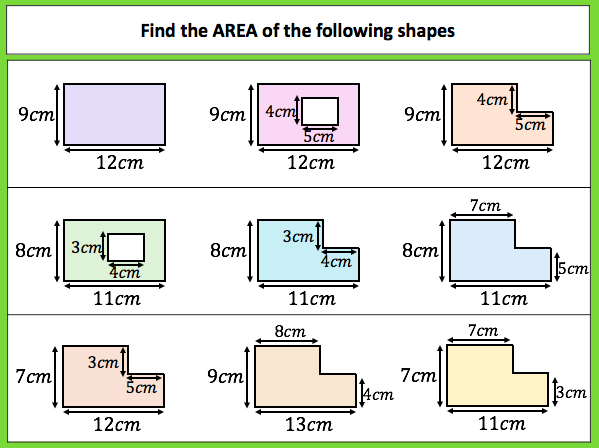
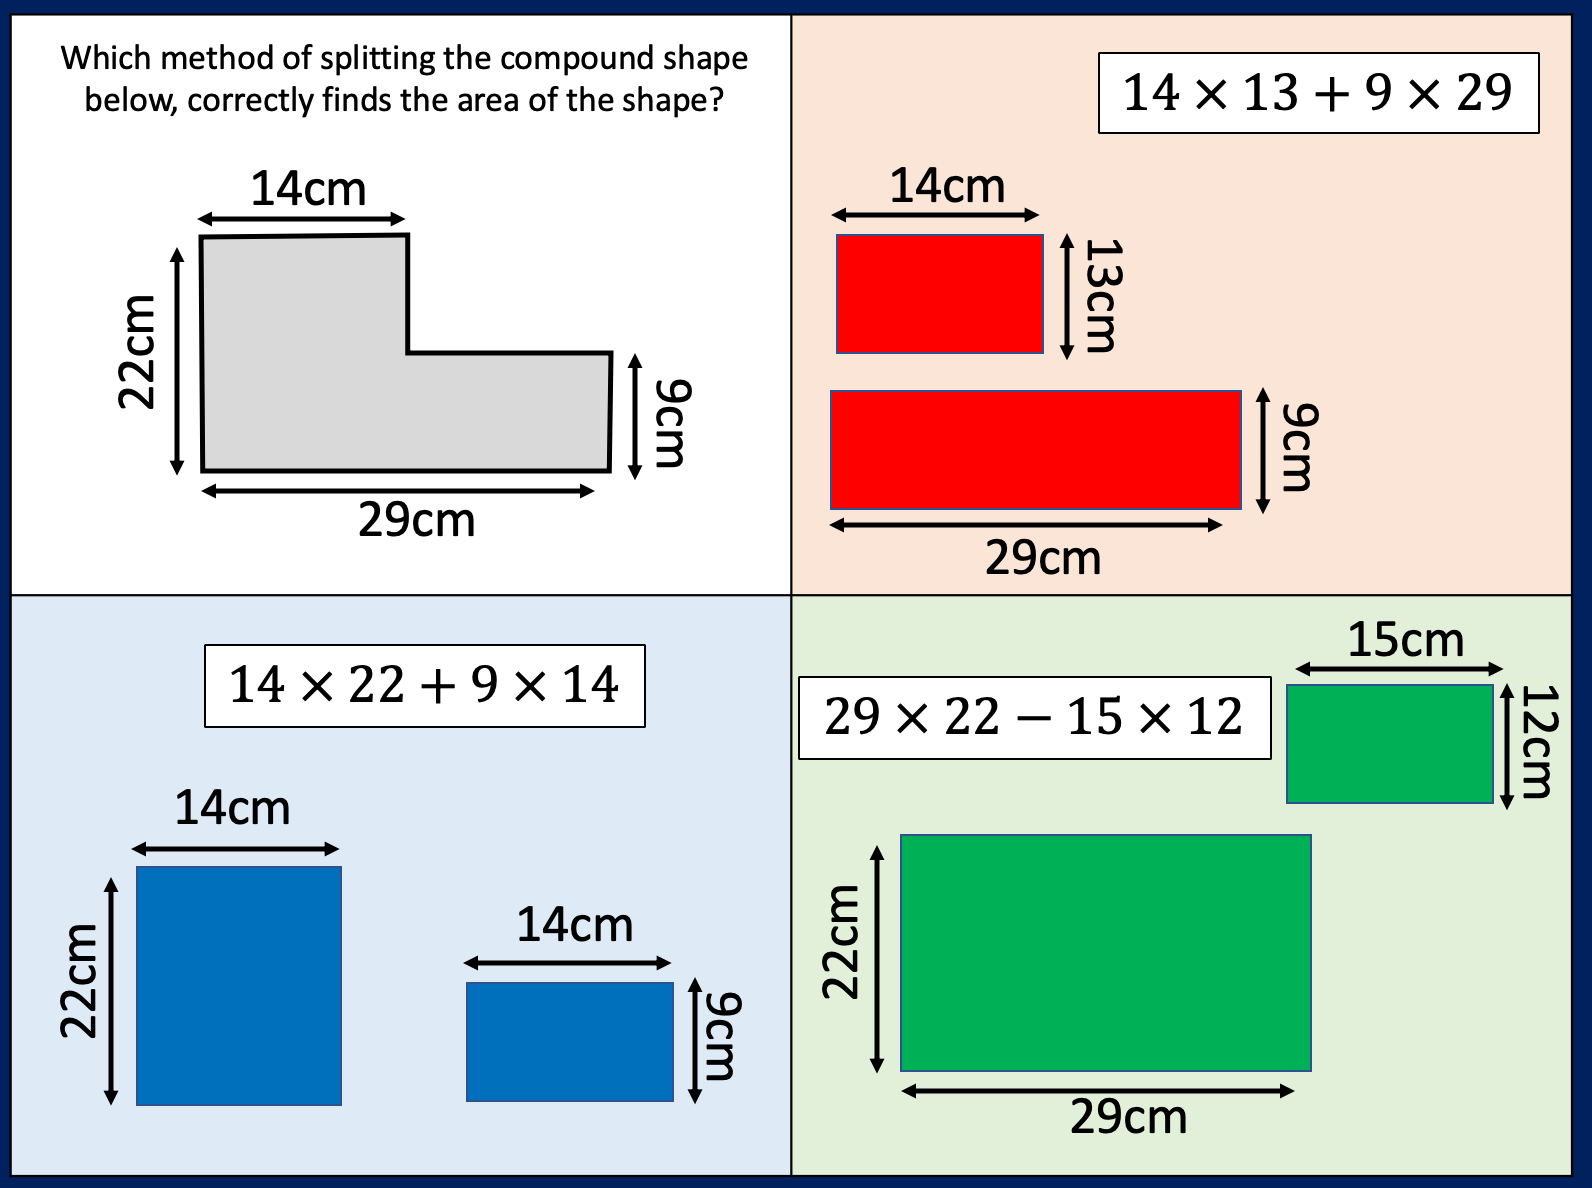
combining two shapes for the same area

Quadratic Equations

Heres a simple starter when looking at solving Quadratics:

Screen Shot 2019-03-26 at 21.19.50

Students in year 10 are looking at Quadratic Graphs. They had a tricky question which relied on their understanding of y-intercepts, x-intercepts and turning points. They also needed to understand that a quadratic graph has symmetry and you can find all the above using the graph or the equation.

In the problem the students have to match the equations with the graph. Students get the chance to see the difference between y = (x – 2)(x – 4) and y = -(x – 2)(x – 4)

Students can also see at which x value the line of symmetry lies and the turning point is

Screen Shot 2018-02-26 at 20.36.55

The second problem requires students to identify the x-intercepts from each equation and the distance between these intercepts.

Screen Shot 2018-02-26 at 20.36.46

The following slides work through a problem similar to the students met on a test but begins with a simplified model and builds up to a more challenging one.

Quadratic Graphs

Screen Shot 2018-02-26 at 20.37.17

I was thinking I’d give year 10 Ss a grid to fill in. They have looked at expanding brackets. Then we can look at what is the same and what is different. If they could spot patterns to help them factorise

Screen Shot 2019-03-03 at 23.12.34Screen Shot 2019-03-03 at 23.09.35

Standard Form

I’m about to start SF with year 10 and thought i’d start with a little ‘which is bigger?’ starter (below) and then look at this VERY old video. I really like how students can look at the difference x10 has. I have various worksheets that I have made over the years but powers of ten can produce some interesting discussions on population sizes, distances between places/planets.

sfStandard Form

Standard Form worksheet

Standard Formsf1sf2.pngsf3.pngsf4.png

Probability

I am going to start the probability unit with my year 9 middle set class this week and have decided to start with listing outcomes. I have the lesson planned and then i started thinking about all the approaches we teach when teaching probability; using a probability tree, sample space diagrams, listing outcomes, venn diagrams, two way tables. I started to wonder how many of my class know why some are useful in some situations for example for 2 events where you want to know all the outcomes or if its just to know P(flipping 4 tails in a row)

I thought a good discussion point could be this question I have created. It also recaps a previous topic on types of number and a previous discussion on what happens when odd/even numbers are added.

prob

redbluegreenyellowqu

Students could list the outcomes, discussions could be had on how many there would be first. Students could use a probability tree and discuss why other types of diagrams aren’t helpful.

UPDATE!

Multiple ways to look at a problem

Screen Shot 2018-10-16 at 21.52.59Screen Shot 2018-10-16 at 21.54.44

Speed Distance Time

I have been working on Speed Distance Time and Distance/Time Graphs with year 10. They have been looking at Gradients of a line with their other Maths teacher so I thought i’d spend a lesson looking at SDT then move on to the graphs.

Students were having difficulty using proportional reasoning to find the speed. They understood that Speed was a measure of distance travelled over a period of time, usually 1 hour. They also knew mph and km/h as units but i felt they didnt seem to grasp that if the speed was constant and you travelled at 12mph then you would move 6miles in 30 minutes and all the proportion work we looked at on Percentages seemed lost. I did remind them that when we found 10% of a number we could find 20% so if we moved 40mph then finding the distance in 2 hours was also easy to find. I suspect from talking to students they have mostly dealt with SDT using a formula which has its uses but not thinking in a proportional sense.

I created a few activities to get students thinking about speed proportionally

Distance Time Graphsspeed 2.pngspeed.png

I wanted students to be able to then move on to looking at speed on a distance time graph. It was important to me they used the proportional reasoning again or extend the lines to make the time 1 hour if they prefer.

speed 3

UPDATE!

I hope students can see that some questions could be solved by scaling up the time and some by looking at the relationship between time and distance

speed6Speed Proportion

Volume

This week I was tasked with teaching Volume to year 10 and I thought that this would be a fairly straight forward lesson. I decided to start with a starter whereby I told the class I had 24 cubes and I wanted to arrange them into a cuboid (using all the cubes) I gave them some time to discuss this problem. Some students took to drawing cubes in their books, others sat looking blankly so when one student pointed out that I had a box of unifix cubes in the room and could he use some. I allowed the students to use the cubes to help them with the problem. One girl built a cube with dimensions 2x3x4 but the rest made frames without cubes inside or were unsure how wide to make the cubes. They didn’t seem comfortable putting cubes together and seeing how it went. We looked at the cuboid that was made and worked out what the dimensions were. I tipped the cuboid over and asked them what the dimensions were. It took a few moments for someone to recognise it was the same numbers;2,3,4. I asked the students how many cubes there were in the cuboid (which was now on its side) and I was surprised to see some students counting cubes. One student shared that she thought we were looking at Volume (which was displayed as the title) and so you work this out by doing length x width x height so it was 2 x 3 x 4. After a pause the answer was given; 24. I assumed that they would know that as i hadn’t removed or added a cube that the volume would stay the same. For some the idea of conservation was still not concrete in their minds and it seemed the commutative law wasn’t either.

So I started on a series of tasks designed to test this. I’ll report back once I have a response from the class on the tasks below.

Volume

[Conservation refers to the ability to determine that a certain quantity will remain the same despite adjustment of the container, shape, or apparent size. – Piaget]

cube 1cube 2cube 3

Students have used Plan, Elevation and Isometric drawings to help them understand Volume of Cuboids. The discussed the idea of layers of cubes and how many cubes in each layer.

I gave a class this task and it was interesting to see how they used the idea of layers to help them answer it. A few students used 27 minus the cubes they could see but a number of students ‘filled’ in the missing cubes to make the 3cm cube. My thanks to Prof Smudge (Maths medicine) for this task.

I will be giving my year 10 class this task tomorrow

Screen Shot 2019-01-28 at 20.21.57.png

Screen Shot 2019-01-29 at 21.16.27.png

Screen Shot 2019-05-23 at 12.44.39.png

Fractions Game

Fraction Dinners

Here’s a game I made for year 9 but can be used with most groups as a revision on equivalent fractions. I also used it as a task to discuss adding fractions and other ideas such as 24/24 equals a whole.

Students were in pairs and took it in turns to roll a dice.

They follow the instructions on the screen and find the sector that equals the fraction(s) on screen. EG if a student rolls a 3 then they find a fraction that equals 1/3 such as 7/21 or 6/18. The aim is to fill the circle so as the circle gets filled the sector pieces needed are smaller.

Fraction Dinners 1

Fraction Dinners 2Fraction Dinners 3

The students enjoyed the game and there was a lot of students discussing and noticing that fractions equal to 1/6 had a denominator 6 times more than the numerator or 1/4 is 4 times and 1/3 is 3 times etc. They also looked at why the fractions added to make 1. So when left with 4/32 + 5/30 + 10/80 + 7/56 + 3/12 + 10/48 they tried to show why it made 1.

xsfhdh

frac piefract pie

Transformations

Here are a selection of resources i have made on translation where the students are thinking about the effects of the transformations on the co-ordinates. These can be drawn but students will have a chance to notice patterns and see how each transformation changes the x and y co-ordinate. The mixed starter is one that combines all the transformations that produce congruent shapes.translationTranslationrotationRotationenlargementEnlargement with Negative Scale Factor

Here’s a mixed transformation starter. I used Geogebra to show the solutions but students don’t need to draw them to solve this. I Encourage students to think about what will happen to the coordinates after a reflection etc.

https://babbey-my.sharepoint.com/:p:/g/personal/konstantineh_barkingabbeyschool_co_uk/EdDzb4yIcS9Er4dJ6Go0r60BXS_h7IqJkUypTHIAKatplw?e=1NbNEe

Screen Shot 2019-02-11 at 20.53.28Screen Shot 2019-02-11 at 20.25.09

Screen Shot 2020-01-04 at 22.10.45

ReflectionScreen Shot 2020-03-04 at 21.45.21Screen Shot 2020-03-04 at 21.45.15Screen Shot 2020-03-04 at 21.44.53Screen Shot 2020-03-04 at 21.44.47

and now we are on to rotation

Rotationrot1rot2


Fractions

I recently created and shared this question on fractions with a year 8 class

fraction number linefraction number line

I received the following responses. We had a good discussion about decimals in fractions and scales on a number line and also about dealing with fractions with different denominators.

IMG_6061img_6062.jpgimg_6063.jpgimg_6064.jpg

UPDATE!

Here is a match up activity where students have to find the 3 that are not equivalent to the other 9 expressions. Students can discuss cancelling fractions and what can and can not be done when working with fractions

Multiplying FractionsMultiplying Fractions 1

Simultaneous equations

Sim EqSim Eq

I spent a few lessons teaching S.E. i started by giving them the following

x + y = 10

What could x and y equal?

students spent time thinking of responses. Eventually students came to the conclusion it had an infinite amount of solutions. I then introduced a different equation:

x – y = 4

Again, eventually they realised there was an infinite amount of solutions. I then asked if any solutions fit both equations.

After a few lessons on SE i realised the common errors were cropping up:

Not always eliminating correctly when solving for one variable

If multiplying an equation through, forgetting to multiply every term

Substituting incorrectly

Finding solutions that worked for only one equation.

I created a document to get students to spot the common errors and decide on what the best advice would be:

simeqsim eq

This worked well and students seemed to recogise these errors in their own work

Sim Equ


A few lessons later i gave them a task to unscramble 3 SE questions that had been mixed. I left the original questions up and said they could work through the questions alone and then check using the sheet to see if they were right or the could cut and rearrange the answers. This worked well to support the students who were struggling with the topic


SE Jumblese

I have made a slide with some questions that might be discussed before you try formal SE questions

12 comnected Qs Simultaneous Equations

Screen Shot 2018-11-29 at 18.39.06.png